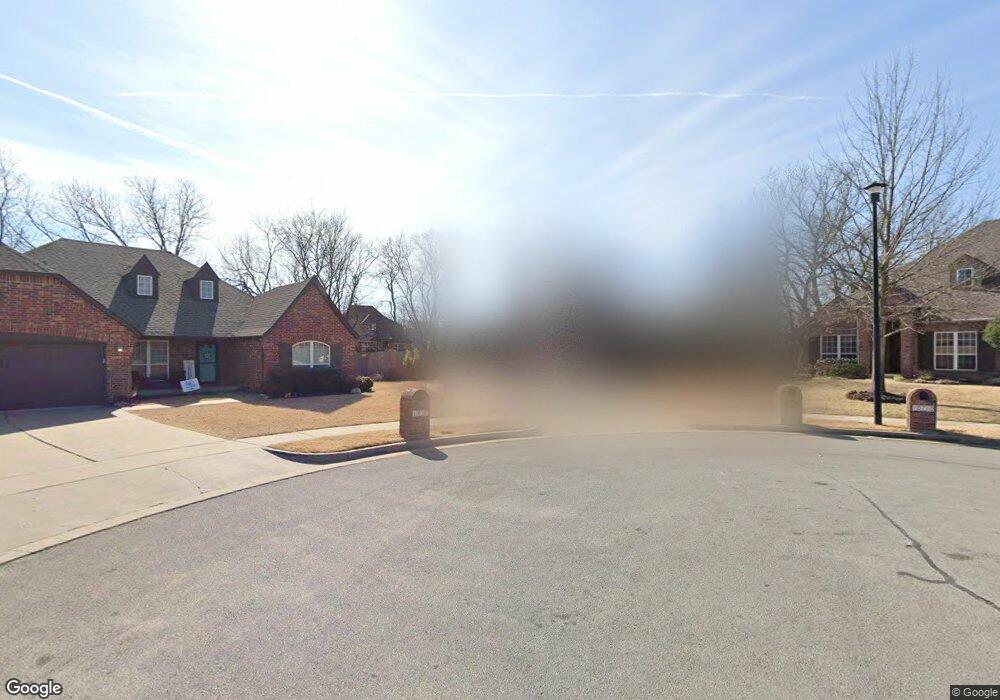
10709 S James Ct Sapulpa, OK 74066
Estimated Value: $373,183 - $455,000
--
Bed
2
Baths
2,294
Sq Ft
$174/Sq Ft
Est. Value
About This Home
This home is located at 10709 S James Ct, Sapulpa, OK 74066 and is currently estimated at $398,046, approximately $173 per square foot. 10709 S James Ct is a home located in Tulsa County with nearby schools including Jenks West Elementary School, Jenks West Intermediate Elementary School, and Jenks Middle School.
Ownership History
Date
Name
Owned For
Owner Type
Purchase Details
Closed on
Sep 12, 2013
Sold by
Lamb Jeffrey M and Lamb Stacy A
Bought by
Hanby Crystal M and Hanby Darrin C
Current Estimated Value
Home Financials for this Owner
Home Financials are based on the most recent Mortgage that was taken out on this home.
Original Mortgage
$242,276
Outstanding Balance
$180,866
Interest Rate
4.41%
Mortgage Type
FHA
Estimated Equity
$217,180
Purchase Details
Closed on
Oct 22, 2012
Sold by
Lamb Jeffrey M and Lamb Stacy A
Bought by
Lamb Jeffrey M and Lamb Stacy A
Purchase Details
Closed on
May 16, 2007
Sold by
Terry L Davis Homes Inc
Bought by
Lamb Jeffery M and Lamb Stacy A
Create a Home Valuation Report for This Property
The Home Valuation Report is an in-depth analysis detailing your home's value as well as a comparison with similar homes in the area
Home Values in the Area
Average Home Value in this Area
Purchase History
| Date | Buyer | Sale Price | Title Company |
|---|---|---|---|
| Hanby Crystal M | $245,500 | Titan Title & Clsoing Llc | |
| Lamb Jeffrey M | -- | None Available | |
| Lamb Jeffery M | $220,000 | Eagle Title |
Source: Public Records
Mortgage History
| Date | Status | Borrower | Loan Amount |
|---|---|---|---|
| Open | Hanby Crystal M | $242,276 |
Source: Public Records
Tax History Compared to Growth
Tax History
| Year | Tax Paid | Tax Assessment Tax Assessment Total Assessment is a certain percentage of the fair market value that is determined by local assessors to be the total taxable value of land and additions on the property. | Land | Improvement |
|---|---|---|---|---|
| 2024 | $3,520 | $28,509 | $3,744 | $24,765 |
| 2023 | $3,520 | $28,649 | $4,045 | $24,604 |
| 2022 | $3,447 | $26,815 | $4,633 | $22,182 |
| 2021 | $3,386 | $26,005 | $4,493 | $21,512 |
| 2020 | $3,312 | $26,005 | $4,493 | $21,512 |
| 2019 | $3,334 | $26,005 | $4,493 | $21,512 |
| 2018 | $3,357 | $26,005 | $4,493 | $21,512 |
| 2017 | $3,302 | $27,005 | $4,666 | $22,339 |
| 2016 | $3,383 | $27,005 | $4,666 | $22,339 |
| 2015 | $3,448 | $27,005 | $4,666 | $22,339 |
| 2014 | $3,526 | $27,005 | $4,666 | $22,339 |
Source: Public Records
Map
Nearby Homes
- 3710 W 110th St S
- 3706 W 106th St S
- 10910 S Olmsted St
- 11009 Augusta Dr
- 10739 Masters Cir
- 11275 S Douglas Ave
- 2957 W 114th Place S
- 10417 S 33rd West Ave
- 10732 S 33rd West Ave
- 11608 S Union Ave
- 10317 S Nathan St
- 2629 W 115th St S
- 11602 S 30th West Ave
- 2012 W 109th St S
- 11710 S Willow Place
- 11728 S Willow Place
- 11206 S Redbud St
- 12002 S Vine St
- 1623 W 114th St
- 12108 S Elm St
- 10709 S James Ct
- 10710 S James Ct
- 10710 S James Ct
- 10707 S James Ct
- 10708 S James Ct
- 10705 S James Ct
- 3409 W 109th St S
- 3411 W 109th St S
- 10815 S Kennedy St
- 10815 S Kennedy St
- 10813 S Kennedy St
- 10813 S Kennedy St
- 3407 W 109th St S
- 10817 S Kennedy St
- 3413 W 109th St S
- 10819 S Kennedy St
- 3405 W 109th St S
- 10819 S Kennedy St W
- 3601 W 108th Ct
- 3601 W 108th Ct