Estimated Value: $415,724 - $463,000
5
Beds
2
Baths
2,142
Sq Ft
$202/Sq Ft
Est. Value
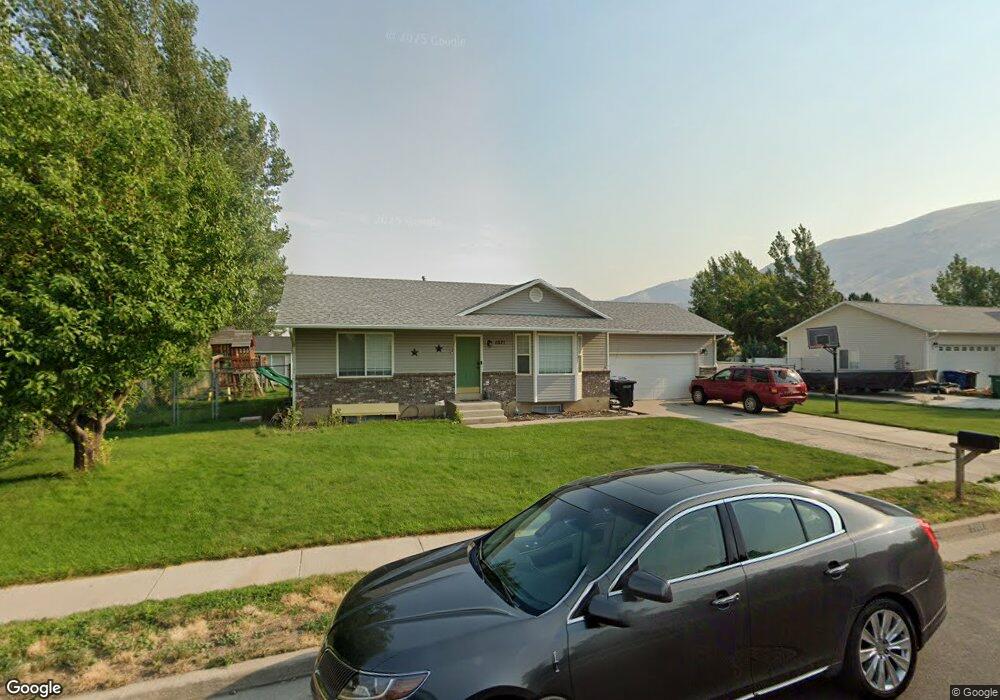
About This Home
This home is located at 1071 E 30 S, Hyrum, UT 84319 and is currently estimated at $432,431, approximately $201 per square foot. 1071 E 30 S is a home located in Cache County with nearby schools including Canyon School, South Cache Middle School, and Mountain Crest High School.
Ownership History
Date
Name
Owned For
Owner Type
Purchase Details
Closed on
Apr 10, 2020
Sold by
Kaha Kaniala B and Kaha Samantha N
Bought by
Johnson Kristopher and Johnson Emilie
Current Estimated Value
Home Financials for this Owner
Home Financials are based on the most recent Mortgage that was taken out on this home.
Original Mortgage
$248,000
Outstanding Balance
$219,221
Interest Rate
3.4%
Mortgage Type
New Conventional
Estimated Equity
$213,210
Purchase Details
Closed on
May 20, 2019
Sold by
Kaha Kaniala B
Bought by
Kaha Kaniala B and Kaha Samantha N
Home Financials for this Owner
Home Financials are based on the most recent Mortgage that was taken out on this home.
Original Mortgage
$200,651
Interest Rate
4.25%
Mortgage Type
FHA
Purchase Details
Closed on
Feb 25, 2016
Sold by
Houston Terrance and Houston Shannel F
Bought by
Kaha Kaniala B
Home Financials for this Owner
Home Financials are based on the most recent Mortgage that was taken out on this home.
Original Mortgage
$175,266
Interest Rate
4.62%
Mortgage Type
FHA
Purchase Details
Closed on
Jan 5, 2012
Sold by
Houston Terrance
Bought by
Houston Terrance and Houston Shannel F
Purchase Details
Closed on
May 17, 2011
Sold by
The Secretary Of Housing & Urban Develop
Bought by
Houston Terrance
Home Financials for this Owner
Home Financials are based on the most recent Mortgage that was taken out on this home.
Original Mortgage
$131,826
Interest Rate
4.75%
Mortgage Type
FHA
Purchase Details
Closed on
Mar 4, 2011
Sold by
Chase Home Finance Llc
Bought by
Secretary Of Housing & Urban Development
Purchase Details
Closed on
Jan 4, 2011
Sold by
Nielson Deidri
Bought by
Chase Home Finance Llc
Purchase Details
Closed on
Dec 26, 2007
Sold by
Marroquin Gonzalo
Bought by
Nielson Deidri
Home Financials for this Owner
Home Financials are based on the most recent Mortgage that was taken out on this home.
Original Mortgage
$164,180
Interest Rate
6.21%
Mortgage Type
FHA
Purchase Details
Closed on
Jul 20, 2005
Sold by
Spillman Technologies Inc
Bought by
Marroquin Gonzalo
Home Financials for this Owner
Home Financials are based on the most recent Mortgage that was taken out on this home.
Original Mortgage
$28,100
Interest Rate
5.56%
Mortgage Type
Stand Alone Second
Create a Home Valuation Report for This Property
The Home Valuation Report is an in-depth analysis detailing your home's value as well as a comparison with similar homes in the area
Home Values in the Area
Average Home Value in this Area
Purchase History
| Date | Buyer | Sale Price | Title Company |
|---|---|---|---|
| Johnson Kristopher | -- | Pinnacle Title | |
| Kaha Kaniala B | -- | Hickman Land Title Logan | |
| Kaha Kaniala B | -- | Heritage Title | |
| Houston Terrance | -- | Accommodation | |
| Houston Terrance | -- | American Secure Title Logan | |
| Secretary Of Housing & Urban Development | -- | Backman Fptp | |
| Chase Home Finance Llc | $178,204 | Etitle Insurance Agency | |
| Nielson Deidri | -- | Heritage West Title | |
| Marroquin Gonzalo | -- | Cache Title Company |
Source: Public Records
Mortgage History
| Date | Status | Borrower | Loan Amount |
|---|---|---|---|
| Open | Johnson Kristopher | $248,000 | |
| Previous Owner | Kaha Kaniala B | $200,651 | |
| Previous Owner | Kaha Kaniala B | $175,266 | |
| Previous Owner | Houston Terrance | $131,826 | |
| Previous Owner | Nielson Deidri | $164,180 | |
| Previous Owner | Marroquin Gonzalo | $28,100 | |
| Previous Owner | Marroquin Gonzalo | $112,400 |
Source: Public Records
Tax History
| Year | Tax Paid | Tax Assessment Tax Assessment Total Assessment is a certain percentage of the fair market value that is determined by local assessors to be the total taxable value of land and additions on the property. | Land | Improvement |
|---|---|---|---|---|
| 2025 | $1,568 | $225,115 | $0 | $0 |
| 2024 | $1,670 | $223,965 | $0 | $0 |
| 2023 | $1,522 | $195,095 | $0 | $0 |
| 2022 | $1,588 | $195,100 | $0 | $0 |
| 2021 | $1,568 | $296,785 | $65,050 | $231,735 |
| 2020 | $1,249 | $221,910 | $65,050 | $156,860 |
| 2019 | $1,178 | $196,860 | $40,000 | $156,860 |
| 2018 | $1,092 | $176,400 | $40,000 | $136,400 |
| 2017 | $1,076 | $90,200 | $0 | $0 |
| 2016 | $1,101 | $90,200 | $0 | $0 |
| 2015 | $1,032 | $84,395 | $0 | $0 |
| 2014 | $1,009 | $84,395 | $0 | $0 |
| 2013 | -- | $84,395 | $0 | $0 |
Source: Public Records
Map
Nearby Homes
Your Personal Tour Guide
Ask me questions while you tour the home.