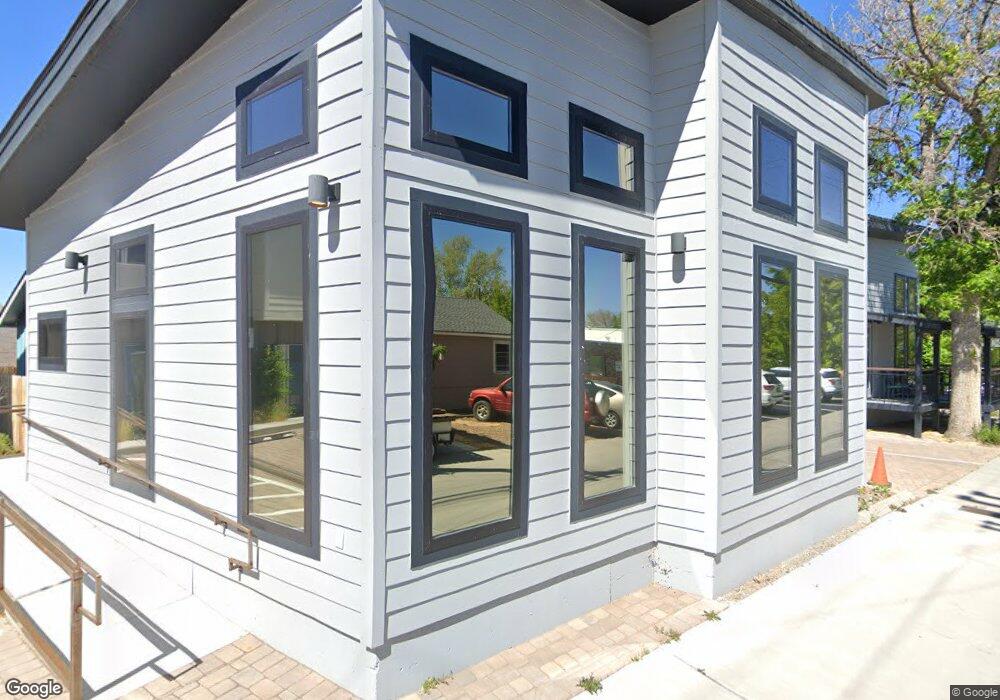
1071 Haskell St Reno, NV 89509
MidTown NeighborhoodEstimated Value: $475,843
2
Beds
2
Baths
2,266
Sq Ft
$210/Sq Ft
Est. Value
About This Home
This home is located at 1071 Haskell St, Reno, NV 89509 and is currently estimated at $475,843, approximately $209 per square foot. 1071 Haskell St is a home located in Washoe County with nearby schools including Mount Rose K-8 School of Languages, Darrell C Swope Middle School, and Reno High School.
Ownership History
Date
Name
Owned For
Owner Type
Purchase Details
Closed on
Nov 4, 2020
Sold by
Gna Holdings Llc
Bought by
Rt Merchant Llc
Current Estimated Value
Home Financials for this Owner
Home Financials are based on the most recent Mortgage that was taken out on this home.
Original Mortgage
$400,000
Outstanding Balance
$353,498
Interest Rate
2.8%
Mortgage Type
Commercial
Estimated Equity
$120,594
Purchase Details
Closed on
Apr 29, 2016
Sold by
Counseling And Educational Services Llc
Bought by
Gna Holdings Llc
Home Financials for this Owner
Home Financials are based on the most recent Mortgage that was taken out on this home.
Original Mortgage
$137,500
Interest Rate
3.73%
Mortgage Type
Commercial
Purchase Details
Closed on
Jun 28, 2013
Sold by
Evarts Frank and Evarts Melvin F
Bought by
Counseling And Educational Services Llc
Create a Home Valuation Report for This Property
The Home Valuation Report is an in-depth analysis detailing your home's value as well as a comparison with similar homes in the area
Home Values in the Area
Average Home Value in this Area
Purchase History
| Date | Buyer | Sale Price | Title Company |
|---|---|---|---|
| Rt Merchant Llc | $350,000 | Ticor Title Reno | |
| Gna Holdings Llc | $275,000 | First Centennial Title | |
| Counseling And Educational Services Llc | $147,500 | None Available |
Source: Public Records
Mortgage History
| Date | Status | Borrower | Loan Amount |
|---|---|---|---|
| Open | Rt Merchant Llc | $400,000 | |
| Previous Owner | Gna Holdings Llc | $137,500 |
Source: Public Records
Tax History
| Year | Tax Paid | Tax Assessment Tax Assessment Total Assessment is a certain percentage of the fair market value that is determined by local assessors to be the total taxable value of land and additions on the property. | Land | Improvement |
|---|---|---|---|---|
| 2026 | $4,149 | $122,160 | $47,258 | $74,902 |
| 2025 | $3,843 | $120,415 | $43,320 | $77,096 |
| 2024 | $3,843 | $119,901 | $41,350 | $78,551 |
| 2023 | $3,559 | $62,705 | $39,381 | $23,324 |
| 2022 | $1,549 | $55,081 | $35,443 | $19,638 |
| 2021 | $1,439 | $45,985 | $26,254 | $19,731 |
| 2020 | $1,254 | $42,823 | $26,254 | $16,569 |
| 2019 | $1,194 | $38,204 | $22,504 | $15,700 |
| 2018 | $1,140 | $35,683 | $20,628 | $15,055 |
| 2017 | $1,094 | $33,527 | $18,753 | $14,774 |
| 2016 | $1,067 | $29,036 | $15,940 | $13,096 |
| 2015 | $1,065 | $28,923 | $15,940 | $12,983 |
| 2014 | $1,041 | $28,248 | $15,940 | $12,308 |
| 2013 | -- | $27,854 | $15,940 | $11,914 |
Source: Public Records
Map
Nearby Homes
- 60 Caliente St
- 222 W Arroyo St Unit 2
- 243 Claremont St
- 343 & 347 Mount Rose St St
- 343 Mount Rose St
- 943 S Wells Ave
- 800 S Center St
- 400 Claremont St
- 1339 Locust St
- 1217 Lander St
- 1001 Lander St
- 1418 Lander St
- 230 Glenmanor Dr
- 453 Cheney St
- 459 Cheney St
- 446 Roberts St
- 814 S Arlington Ave
- 536 Sinclair St
- 474 W Plumb Ln
- 1522 Kirman Ave Unit 1520 / 1522
- 1069 Haskell St
- 1067 Haskell St
- 1065 Haskell St
- 115 Caliente St
- 121 Caliente St
- 1059 Haskell St
- 109 Caliente St
- 123 / 125 Caliente St
- 117 Caliente St
- 123 Caliente St
- 125/123/12 Caliente St
- 1053 Haskell St
- 125 Caliente St
- 1078 Haskell St
- 1058 Watt St Unit H
- 1058 Watt St
- 1072 Haskell St
- 1070 Haskell St
- 0 Haskell Row
- 1037 Haskell St