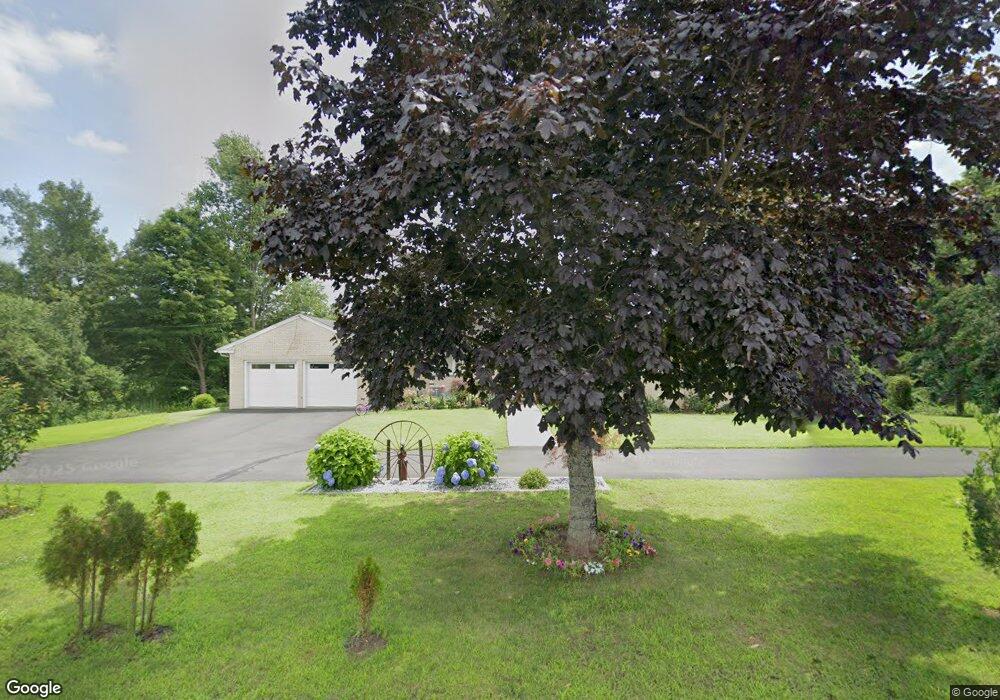
1071 Sheldon St West Suffield, CT 06093
Estimated Value: $506,267 - $576,000
3
Beds
3
Baths
1,878
Sq Ft
$283/Sq Ft
Est. Value
About This Home
This home is located at 1071 Sheldon St, West Suffield, CT 06093 and is currently estimated at $531,067, approximately $282 per square foot. 1071 Sheldon St is a home located in Hartford County with nearby schools including A. Ward Spaulding School, Mcalister Intermediate School, and Suffield Middle School.
Ownership History
Date
Name
Owned For
Owner Type
Purchase Details
Closed on
Jun 27, 2022
Sold by
Margaret M Nocturne Ret and Nocturne
Bought by
Katrick Mark R and Katrick Marie Lisa
Current Estimated Value
Purchase Details
Closed on
Nov 13, 2020
Sold by
Farhad Sabrina L
Bought by
Avila Roberto R
Home Financials for this Owner
Home Financials are based on the most recent Mortgage that was taken out on this home.
Original Mortgage
$375,250
Interest Rate
2.8%
Mortgage Type
New Conventional
Purchase Details
Closed on
Jul 30, 2020
Sold by
Farhad Marvin
Bought by
Farhad Sabrina L
Purchase Details
Closed on
Jun 7, 2019
Sold by
Farhad Marvin
Bought by
Farhad Marvin and Farhad Sabrina L
Home Financials for this Owner
Home Financials are based on the most recent Mortgage that was taken out on this home.
Original Mortgage
$191,000
Interest Rate
4.1%
Mortgage Type
New Conventional
Purchase Details
Closed on
Jan 3, 2018
Sold by
Nocturne Margaret
Bought by
Farhad Marvin
Home Financials for this Owner
Home Financials are based on the most recent Mortgage that was taken out on this home.
Original Mortgage
$220,000
Interest Rate
3.92%
Mortgage Type
New Conventional
Create a Home Valuation Report for This Property
The Home Valuation Report is an in-depth analysis detailing your home's value as well as a comparison with similar homes in the area
Home Values in the Area
Average Home Value in this Area
Purchase History
| Date | Buyer | Sale Price | Title Company |
|---|---|---|---|
| Katrick Mark R | $91,000 | None Available | |
| Avila Roberto R | $395,000 | None Available | |
| Farhad Sabrina L | -- | None Available | |
| Farhad Marvin | -- | -- | |
| Farhad Marvin | $273,000 | -- | |
| Farhad Marvin | $273,000 | -- |
Source: Public Records
Mortgage History
| Date | Status | Borrower | Loan Amount |
|---|---|---|---|
| Previous Owner | Avila Roberto R | $375,250 | |
| Previous Owner | Farhad Marvin | $191,000 | |
| Previous Owner | Farhad Marvin | $220,000 |
Source: Public Records
Tax History
| Year | Tax Paid | Tax Assessment Tax Assessment Total Assessment is a certain percentage of the fair market value that is determined by local assessors to be the total taxable value of land and additions on the property. | Land | Improvement |
|---|---|---|---|---|
| 2025 | $6,209 | $265,230 | $74,480 | $190,750 |
| 2024 | $6,002 | $265,230 | $74,480 | $190,750 |
| 2023 | $6,294 | $220,010 | $74,620 | $145,390 |
| 2022 | $6,294 | $220,010 | $74,620 | $145,390 |
| 2021 | $6,301 | $220,010 | $74,620 | $145,390 |
| 2020 | $5,824 | $203,350 | $74,620 | $128,730 |
| 2019 | $5,840 | $203,350 | $74,620 | $128,730 |
| 2018 | $6,248 | $213,080 | $98,070 | $115,010 |
| 2017 | $7,145 | $247,310 | $132,300 | $115,010 |
| 2016 | $7,170 | $254,240 | $132,300 | $121,940 |
| 2015 | $5,610 | $201,950 | $132,300 | $69,650 |
| 2014 | $6,612 | $243,810 | $132,300 | $111,510 |
Source: Public Records
Map
Nearby Homes
- 1054 Mountain Rd
- 02 S Grand St
- 01 S Grand St
- 15 Downing Way
- 200 N Main St
- 1095 S Grand St
- 191 N Main St
- 18 Daniel Cir Unit 18
- 72 Spencer St
- 0 Stone St S Unit 24039713
- 1 E Elaine Dr
- 0 Suffield St Unit 24093452
- 0 Suffield St Unit 24057050
- 85 East St
- 10 Russell Rd
- 5 Maize Ln
- 24 Coppergate Rd
- 76 Newgate Rd
- 424 Bridge St
- 420 Halladay Ave W
- 1071 Sheldon St
- 1063 Sheldon St
- 1091 Sheldon St
- 1105 Sheldon St
- 1033 Sheldon St
- 1011 Sheldon St
- 1001 Sheldon St
- 977 Sheldon St
- 1193 Sheldon St
- 971 Sheldon St
- 1188 Sheldon St
- 991 Sheldon St
- 23/25/9 Sheldon St
- 895 Sheldon St
- 892 Sheldon St
- 892 Sheldon St
- 1235 Mountain Rd
- 885 Sheldon St
- 876 Sheldon St
- 1204 Sheldon St
Your Personal Tour Guide
Ask me questions while you tour the home.