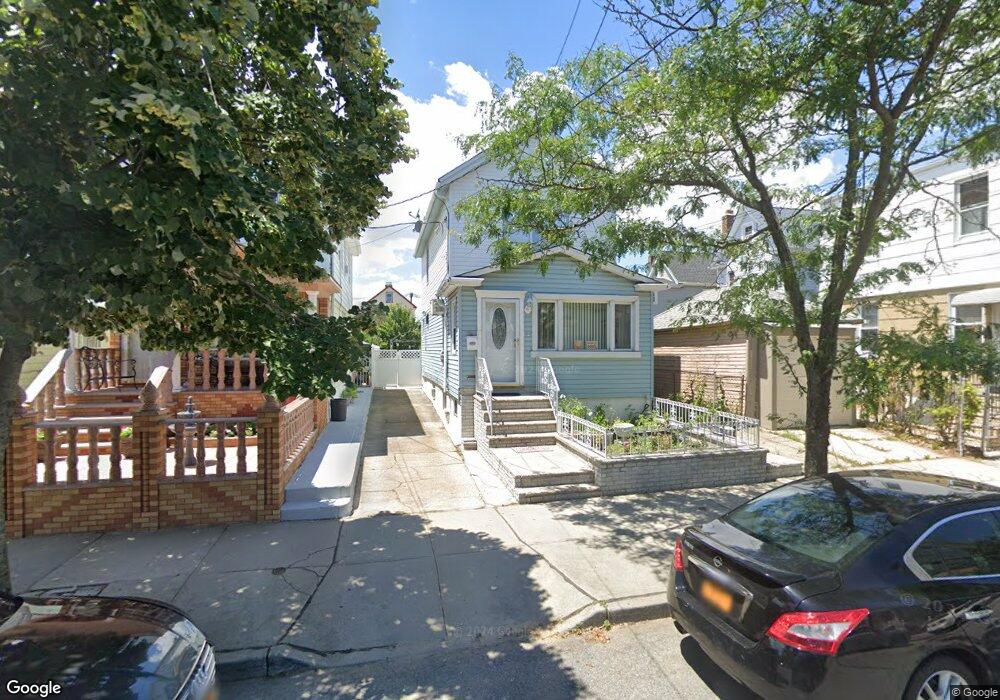
10710 87th St Ozone Park, NY 11417
Ozone Park NeighborhoodEstimated Value: $746,306 - $780,000
--
Bed
--
Bath
1,184
Sq Ft
$640/Sq Ft
Est. Value
About This Home
This home is located at 10710 87th St, Ozone Park, NY 11417 and is currently estimated at $758,327, approximately $640 per square foot. 10710 87th St is a home located in Queens County with nearby schools including P.S. 63 - Old South and Robert H. Goddard High School.
Ownership History
Date
Name
Owned For
Owner Type
Purchase Details
Closed on
Dec 21, 2022
Sold by
Balkissoon Hamewattie and The Dolly Family Trust
Bought by
Singh Richard
Current Estimated Value
Home Financials for this Owner
Home Financials are based on the most recent Mortgage that was taken out on this home.
Original Mortgage
$528,750
Outstanding Balance
$510,646
Interest Rate
6.58%
Mortgage Type
Purchase Money Mortgage
Estimated Equity
$247,681
Purchase Details
Closed on
Jan 22, 2010
Sold by
Balkissoon Hamewattie
Bought by
Balkissoon Amit and Dolly Family Trust
Purchase Details
Closed on
Jun 30, 2005
Sold by
Montaperto Judith
Bought by
Balkissoon Hamewattie and Balkissoon Peter
Home Financials for this Owner
Home Financials are based on the most recent Mortgage that was taken out on this home.
Original Mortgage
$332,800
Interest Rate
5.67%
Mortgage Type
Purchase Money Mortgage
Create a Home Valuation Report for This Property
The Home Valuation Report is an in-depth analysis detailing your home's value as well as a comparison with similar homes in the area
Home Values in the Area
Average Home Value in this Area
Purchase History
| Date | Buyer | Sale Price | Title Company |
|---|---|---|---|
| Singh Richard | $705,000 | -- | |
| Singh Richard | $705,000 | -- | |
| Singh Richard | $705,000 | -- | |
| Balkissoon Amit | -- | -- | |
| Balkissoon Amit | -- | -- | |
| Balkissoon Hamewattie | $416,000 | -- | |
| Balkissoon Hamewattie | $416,000 | -- |
Source: Public Records
Mortgage History
| Date | Status | Borrower | Loan Amount |
|---|---|---|---|
| Open | Singh Richard | $528,750 | |
| Closed | Singh Richard | $528,750 | |
| Previous Owner | Balkissoon Hamewattie | $332,800 |
Source: Public Records
Tax History Compared to Growth
Tax History
| Year | Tax Paid | Tax Assessment Tax Assessment Total Assessment is a certain percentage of the fair market value that is determined by local assessors to be the total taxable value of land and additions on the property. | Land | Improvement |
|---|---|---|---|---|
| 2025 | $5,526 | $29,129 | $8,784 | $20,345 |
| 2024 | $5,526 | $27,515 | $9,487 | $18,028 |
| 2023 | $5,267 | $26,225 | $8,767 | $17,458 |
| 2022 | $5,064 | $38,940 | $13,860 | $25,080 |
| 2021 | $4,978 | $37,920 | $13,860 | $24,060 |
| 2020 | $5,138 | $35,580 | $13,860 | $21,720 |
| 2019 | $4,797 | $34,200 | $13,860 | $20,340 |
| 2018 | $4,455 | $21,854 | $9,436 | $12,418 |
| 2017 | $4,236 | $20,780 | $10,573 | $10,207 |
| 2016 | $4,154 | $20,780 | $10,573 | $10,207 |
| 2015 | $2,364 | $20,228 | $12,319 | $7,909 |
| 2014 | $2,364 | $19,108 | $12,401 | $6,707 |
Source: Public Records
Map
Nearby Homes
- 84-28 108th Ave
- 10724 87th St
- 8509 Sutter Ave
- 84-11 Sutter Ave
- 84-09 107th Ave
- 105-35 86th St
- 105-34 86th St
- 105-47 88 St
- 105-43 88th St
- 105-21 84th St
- 105-04 87th St
- 10751 89th St
- 132-36 84th St
- 84-07 Sutter Ave
- 107-50 90th St
- 132-18 89th St
- 13236 82nd St
- 133-28 86th St
- 133-42 86th St
- 81-56 102nd Rd
- 107-10 87th St
- 10712 87th St
- 10716 87th St
- 86-20 107th Ave
- 8616 107th Ave
- 8620 107th Ave
- 8620 107th Ave Unit 2nd fl
- 8612 107th Ave
- 10718 87th St
- 8608 107th Ave
- 10715 86th St
- 10711 86th St
- 10722 87th St
- 10717 86th St
- 8704 107th Ave
- 10717 86th St
- 8606 107th Ave
- 10719 86th St
- 8706 107th Ave
- 10723 86th St