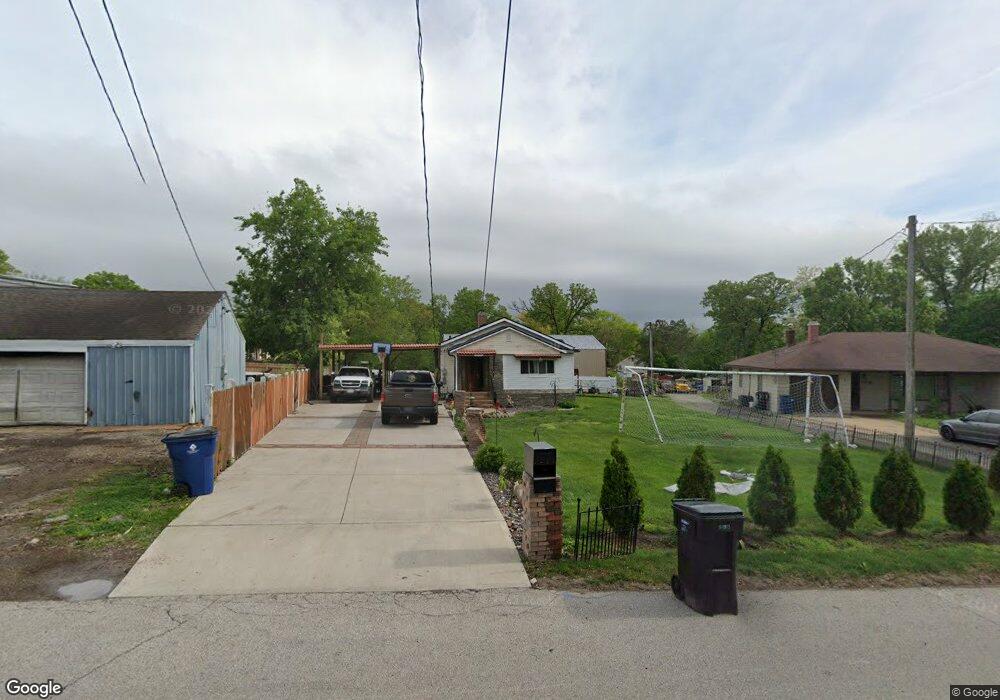
10710 Lacklink Rd Saint Louis, MO 63114
Estimated Value: $127,000 - $143,950
2
Beds
1
Bath
996
Sq Ft
$136/Sq Ft
Est. Value
About This Home
This home is located at 10710 Lacklink Rd, Saint Louis, MO 63114 and is currently estimated at $134,988, approximately $135 per square foot. 10710 Lacklink Rd is a home located in St. Louis County with nearby schools including Willow Brook Elementary School, Pattonville Heights Middle School, and Pattonville High School.
Ownership History
Date
Name
Owned For
Owner Type
Purchase Details
Closed on
Nov 9, 2021
Sold by
Jos Par Llc
Bought by
Garcia Gerardo Garduno and Urquilla Susan Nathaly
Current Estimated Value
Purchase Details
Closed on
May 12, 2017
Sold by
Appel Charles A and Appel Colleen M
Bought by
Appel Trust and Charles And Colleen Appel Trust
Home Financials for this Owner
Home Financials are based on the most recent Mortgage that was taken out on this home.
Interest Rate
4.05%
Purchase Details
Closed on
Mar 15, 2016
Sold by
Dizon Edwin S and Dizon Filipina L
Bought by
Jos Par Llc
Purchase Details
Closed on
Sep 12, 2005
Sold by
Camenzind Jerome K and Camenzind Donna K
Bought by
Dizon Edwin S and Dizon Filipina L
Purchase Details
Closed on
Oct 25, 2002
Sold by
Appel Charles A and Appel Colleen M
Bought by
Camenzind Jerome K and Camenzind Donna K
Purchase Details
Closed on
Sep 20, 2002
Sold by
Niedringhaus Cornelia
Bought by
Appel Charles A and Appel Colleen M
Create a Home Valuation Report for This Property
The Home Valuation Report is an in-depth analysis detailing your home's value as well as a comparison with similar homes in the area
Home Values in the Area
Average Home Value in this Area
Purchase History
| Date | Buyer | Sale Price | Title Company |
|---|---|---|---|
| Garcia Gerardo Garduno | -- | Chesterfield Title Agency | |
| Garcia Gerardo Garduno | -- | Chesterfield Title Agency | |
| Appel Trust | -- | -- | |
| Jos Par Llc | $65,000 | Us Title Maryland Heights | |
| Dizon Edwin S | $32,500 | -- | |
| Camenzind Jerome K | $31,000 | -- | |
| Appel Charles A | $27,500 | -- |
Source: Public Records
Mortgage History
| Date | Status | Borrower | Loan Amount |
|---|---|---|---|
| Previous Owner | Appel Trust | -- |
Source: Public Records
Tax History Compared to Growth
Tax History
| Year | Tax Paid | Tax Assessment Tax Assessment Total Assessment is a certain percentage of the fair market value that is determined by local assessors to be the total taxable value of land and additions on the property. | Land | Improvement |
|---|---|---|---|---|
| 2025 | $2,010 | $27,400 | $7,660 | $19,740 |
| 2024 | $2,010 | $26,050 | $8,630 | $17,420 |
| 2023 | $2,010 | $26,050 | $8,630 | $17,420 |
| 2022 | $1,286 | $14,910 | $3,950 | $10,960 |
| 2021 | $1,281 | $14,910 | $3,950 | $10,960 |
| 2020 | $1,333 | $14,910 | $3,590 | $11,320 |
| 2019 | $1,326 | $14,910 | $3,590 | $11,320 |
| 2018 | $1,270 | $12,940 | $3,230 | $9,710 |
| 2017 | $1,270 | $12,940 | $3,230 | $9,710 |
| 2016 | $1,264 | $12,830 | $3,230 | $9,600 |
| 2015 | $1,250 | $12,830 | $3,230 | $9,600 |
| 2014 | $1,223 | $12,490 | $1,750 | $10,740 |
Source: Public Records
Map
Nearby Homes
- 1841 N Warson Rd
- 10726 Niblic Dr
- 2255 N Warson Rd
- 2300 Ruckert Ave
- 10627 Canter Way
- 2430 Prouhet Ave
- 2450 Fowler Ave
- 2412 Silkwood Dr
- 10490 Canter Way
- 10310 Lackland Rd
- 2454 Prouhet Ave
- 1735 O Connell Ave
- 10301 Niblic Dr
- 10222 Driver Ave
- 10110 Lackland Rd
- 2703 Ashby Rd
- 10040 Driver Ave
- 10719 Thorpe Ave
- 10651 Thorpe Ave
- 10643 Thorpe Ave
- 10716 Lacklink Rd
- 10700 Lacklink Rd
- 10718 Lacklink Rd
- 10715 Lacklink Rd
- 10724 Lacklink Rd
- 10723 Lacklink Rd
- 2113 N Warson Rd
- 10721 Lacklink Rd
- 10728 Lacklink Rd
- 2115 N Warson Rd
- 10727 Lacklink Rd
- 10595 Maddox Place
- 2123 N Warson Rd
- 10734 Lacklink Rd
- 10621 Lackland Rd
- 10731 Lacklink Rd
- 10735 Lacklink Rd
- 10585 Maddox Place
- 10727 Oak Ave
- 2129 N Warson Rd