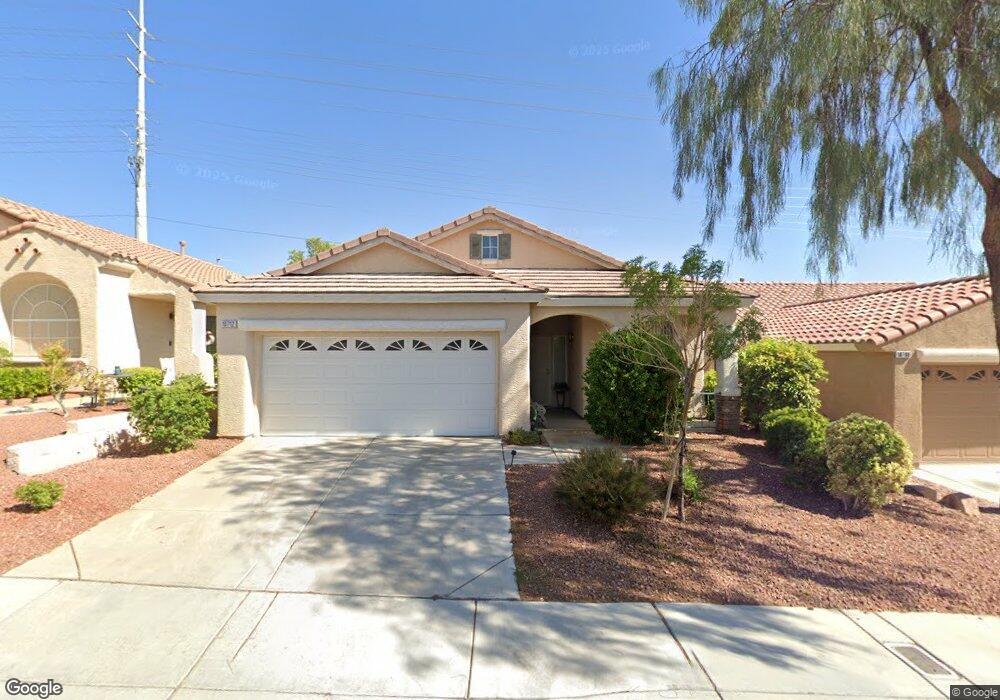
10712 Windrose Point Ave Las Vegas, NV 89144
Summerlin NeighborhoodEstimated Value: $435,000 - $492,000
3
Beds
2
Baths
1,305
Sq Ft
$356/Sq Ft
Est. Value
About This Home
This home is located at 10712 Windrose Point Ave, Las Vegas, NV 89144 and is currently estimated at $463,971, approximately $355 per square foot. 10712 Windrose Point Ave is a home located in Clark County with nearby schools including Ethel W. Staton Elementary School, Sig Rogich Middle School, and Palo Verde High School.
Ownership History
Date
Name
Owned For
Owner Type
Purchase Details
Closed on
Nov 17, 2010
Sold by
Dickens Kevin D and Dickens Veena Lal
Bought by
Qiao Lilin and Ye Zaoyu
Current Estimated Value
Purchase Details
Closed on
Sep 9, 2003
Sold by
Snanoudj Jacques A
Bought by
Dickens Kevin D and Dickens Veena Lal
Home Financials for this Owner
Home Financials are based on the most recent Mortgage that was taken out on this home.
Original Mortgage
$169,200
Interest Rate
6.06%
Mortgage Type
Unknown
Purchase Details
Closed on
Jun 29, 2000
Sold by
Coleman Toll Ltd Partnership
Bought by
Snanoudj Jacques A
Home Financials for this Owner
Home Financials are based on the most recent Mortgage that was taken out on this home.
Original Mortgage
$148,627
Interest Rate
8.67%
Mortgage Type
VA
Create a Home Valuation Report for This Property
The Home Valuation Report is an in-depth analysis detailing your home's value as well as a comparison with similar homes in the area
Home Values in the Area
Average Home Value in this Area
Purchase History
| Date | Buyer | Sale Price | Title Company |
|---|---|---|---|
| Qiao Lilin | $130,000 | Ticor Title Las Vegas | |
| Dickens Kevin D | $188,000 | Fidelity National Title | |
| Snanoudj Jacques A | $145,713 | United Title |
Source: Public Records
Mortgage History
| Date | Status | Borrower | Loan Amount |
|---|---|---|---|
| Previous Owner | Dickens Kevin D | $169,200 | |
| Previous Owner | Snanoudj Jacques A | $148,627 |
Source: Public Records
Tax History Compared to Growth
Tax History
| Year | Tax Paid | Tax Assessment Tax Assessment Total Assessment is a certain percentage of the fair market value that is determined by local assessors to be the total taxable value of land and additions on the property. | Land | Improvement |
|---|---|---|---|---|
| 2025 | $1,976 | $105,156 | $47,950 | $57,206 |
| 2024 | $1,919 | $105,156 | $47,950 | $57,206 |
| 2023 | $1,919 | $88,297 | $34,300 | $53,997 |
| 2022 | $1,863 | $79,249 | $29,750 | $49,499 |
| 2021 | $1,809 | $73,250 | $26,250 | $47,000 |
| 2020 | $1,753 | $71,799 | $25,200 | $46,599 |
| 2019 | $1,702 | $67,335 | $21,350 | $45,985 |
| 2018 | $1,653 | $59,987 | $18,550 | $41,437 |
| 2017 | $1,959 | $59,581 | $17,850 | $41,731 |
| 2016 | $1,566 | $55,234 | $13,300 | $41,934 |
| 2015 | $1,562 | $48,882 | $9,100 | $39,782 |
| 2014 | $1,516 | $47,829 | $7,350 | $40,479 |
Source: Public Records
Map
Nearby Homes
- 10525 Mission Lakes Ave
- 1812 Monterey Cypress St
- 10407 Sawmill Ave
- 10500 Shanna Trellis Ave
- 1617 Stonefield St
- 10525 Findlay Ave
- 10725 Mission Lakes Ave
- 1900 Bellview St
- 1904 Bellview St
- 1600 Remembrance Hill St
- 10528 Cogswell Ave
- 10805 Clarion Ln
- 10737 Heritage Hills Dr
- 1628 Scenic Peak St
- 2004 Bellview St
- 2024 Bay Tree Dr
- 10309 Cogswell Ave
- 10724 Windledge Ave
- 10816 Heritage Hills Dr
- 1709 Pacific Panorama Place
- 10708 Windrose Point Ave
- 10716 Windrose Point Ave
- 10704 Windrose Point Ave
- 10720 Windrose Point Ave
- 10713 Windrose Point Ave
- 10713 Windrose Point Ave
- 10713 Windrose Point Ave
- 10717 Windrose Point Ave
- 10700 Windrose Point Ave
- 10724 Windrose Point Ave
- 10709 Windrose Point Ave
- 10721 Windrose Point Ave
- 10705 Windrose Point Ave
- 10728 Windrose Point Ave
- 10684 Windrose Point Ave
- 10725 Windrose Point Ave
- 10701 Windrose Point Ave
- 10729 Windrose Point Ave
- 10692 Oak Crest Ave
- 10688 Oak Crest Ave