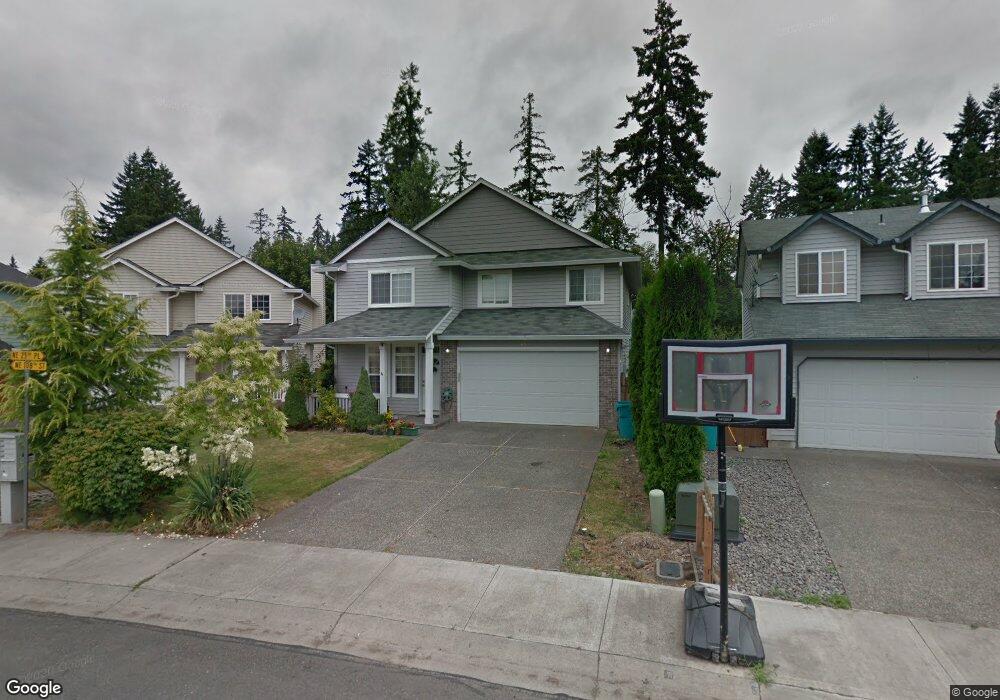
10713 NE 25th Place Vancouver, WA 98686
Estimated Value: $558,000 - $584,572
4
Beds
3
Baths
2,371
Sq Ft
$241/Sq Ft
Est. Value
About This Home
This home is located at 10713 NE 25th Place, Vancouver, WA 98686 and is currently estimated at $571,143, approximately $240 per square foot. 10713 NE 25th Place is a home located in Clark County with nearby schools including Sarah J. Anderson Elementary School, Gaiser Middle School, and Skyview High School.
Ownership History
Date
Name
Owned For
Owner Type
Purchase Details
Closed on
Jan 31, 2025
Sold by
Davis Ray C and Davis Carrie L
Bought by
Craig And Carrie Trust
Current Estimated Value
Purchase Details
Closed on
Mar 21, 2012
Sold by
Davis Carrie L and Mark Carrie L
Bought by
Davis Carrie L and Davis Ray C
Home Financials for this Owner
Home Financials are based on the most recent Mortgage that was taken out on this home.
Original Mortgage
$243,500
Interest Rate
3.84%
Mortgage Type
New Conventional
Purchase Details
Closed on
May 21, 2002
Sold by
Sun Country Homes Inc
Bought by
Mark Carrie L
Home Financials for this Owner
Home Financials are based on the most recent Mortgage that was taken out on this home.
Original Mortgage
$147,850
Interest Rate
6.94%
Create a Home Valuation Report for This Property
The Home Valuation Report is an in-depth analysis detailing your home's value as well as a comparison with similar homes in the area
Home Values in the Area
Average Home Value in this Area
Purchase History
| Date | Buyer | Sale Price | Title Company |
|---|---|---|---|
| Craig And Carrie Trust | -- | None Listed On Document | |
| Davis Carrie L | -- | Stewart Title | |
| Mark Carrie L | $184,848 | First American Title Ins Co |
Source: Public Records
Mortgage History
| Date | Status | Borrower | Loan Amount |
|---|---|---|---|
| Previous Owner | Davis Carrie L | $243,500 | |
| Previous Owner | Mark Carrie L | $147,850 |
Source: Public Records
Tax History Compared to Growth
Tax History
| Year | Tax Paid | Tax Assessment Tax Assessment Total Assessment is a certain percentage of the fair market value that is determined by local assessors to be the total taxable value of land and additions on the property. | Land | Improvement |
|---|---|---|---|---|
| 2025 | $5,609 | $582,368 | $216,600 | $365,768 |
| 2024 | $4,806 | $532,172 | $216,600 | $315,572 |
| 2023 | $5,052 | $492,296 | $202,488 | $289,808 |
| 2022 | $4,748 | $513,803 | $210,300 | $303,503 |
| 2021 | $4,623 | $430,021 | $134,000 | $296,021 |
| 2020 | $4,161 | $392,998 | $123,500 | $269,498 |
| 2019 | $3,861 | $375,628 | $128,400 | $247,228 |
| 2018 | $4,197 | $361,795 | $0 | $0 |
| 2017 | $3,809 | $328,751 | $0 | $0 |
| 2016 | $3,599 | $310,577 | $0 | $0 |
| 2015 | $3,583 | $274,308 | $0 | $0 |
| 2014 | -- | $263,678 | $0 | $0 |
| 2013 | -- | $228,711 | $0 | $0 |
Source: Public Records
Map
Nearby Homes
- 2312 NE 104th St
- 2319 NE 104th St
- 10611 NE 20th Ave
- 2806 NE 105th Cir
- 6717 NE 27th Place
- 10216 NE 27th Ave
- 10619 NE 30th Ave
- 2313 NE 102nd St
- 2506 NE 100th St
- 2016 NE 101st Cir
- 2409 NE 100th St
- 11313 NE Highway 99
- 2002 NE 100th Cir
- 3108 NE 105th Cir
- 6712 NW 26th Ct
- 2812 NE 99th St
- 10400 NE 33rd Ave
- 1611 NE 113th St Unit 322
- 1611 NE 113th St
- 1611 NE 113th St Unit 421
- 10709 NE 25th Place
- 2414 NE 108th St
- 10705 NE 25th Place
- 2504 NE 108th St
- 2526 NE 108th St
- 2410 NE 108th St
- 2501 NE 108th St
- 2503 NE 108th St
- 2411 NE 108th St
- 10708 NE 25th Place
- 10701 NE 25th Place
- 2406 NE 108th St
- 10704 NE 25th Place
- 2407 NE 108th St
- 10625 NE 25th Place
- 10615 NE 25th Place
- 2402 NE 108th St
- 2403 NE 108th St
- 2410 NE 107th St
- 10611 NE 25th Place