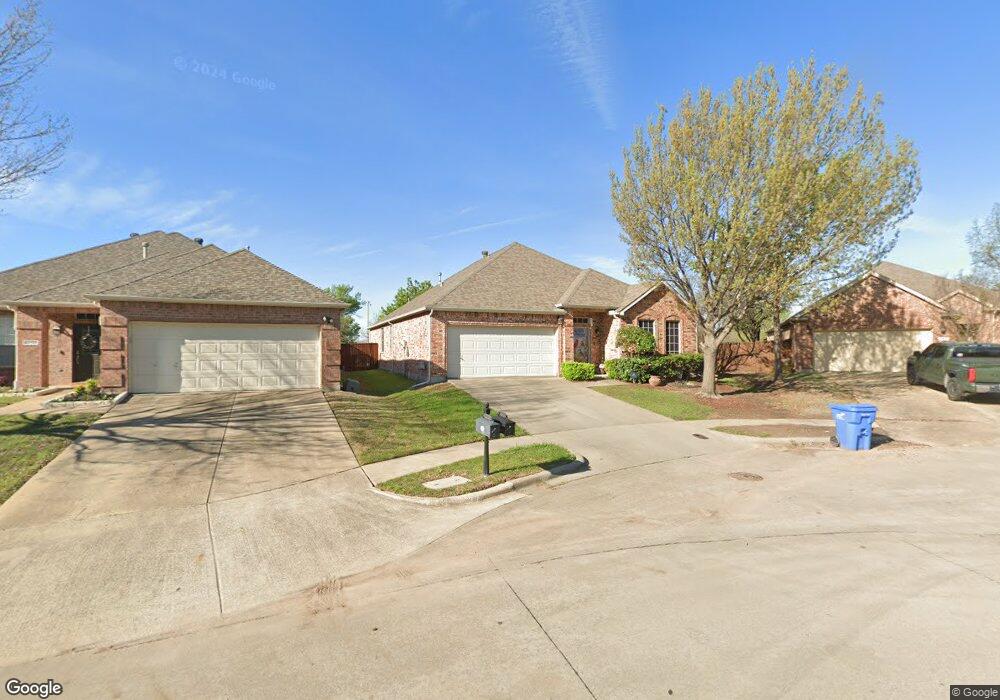
10713 Wolfcreek Ln Rowlett, TX 75089
Waterview NeighborhoodEstimated Value: $392,000 - $402,000
3
Beds
2
Baths
2,230
Sq Ft
$178/Sq Ft
Est. Value
About This Home
This home is located at 10713 Wolfcreek Ln, Rowlett, TX 75089 and is currently estimated at $395,988, approximately $177 per square foot. 10713 Wolfcreek Ln is a home located in Dallas County with nearby schools including Education Center International Academy Rowlett and Providence Academy.
Ownership History
Date
Name
Owned For
Owner Type
Purchase Details
Closed on
Jun 21, 2004
Sold by
Cendant Mobility Financial Corp
Bought by
Winn Arzo and Jackson Jacquetta C
Current Estimated Value
Home Financials for this Owner
Home Financials are based on the most recent Mortgage that was taken out on this home.
Original Mortgage
$150,270
Outstanding Balance
$74,980
Interest Rate
6.31%
Mortgage Type
FHA
Estimated Equity
$321,008
Purchase Details
Closed on
Jan 16, 2004
Sold by
Wagnitz Trevor and Wagnitz Priscilla
Bought by
Cendant Mobility Financial Corp
Purchase Details
Closed on
Mar 29, 2002
Sold by
Centex Homes
Bought by
Wagnitz Trevor and Wagnitz Priscilla
Home Financials for this Owner
Home Financials are based on the most recent Mortgage that was taken out on this home.
Original Mortgage
$161,579
Interest Rate
6.83%
Mortgage Type
FHA
Create a Home Valuation Report for This Property
The Home Valuation Report is an in-depth analysis detailing your home's value as well as a comparison with similar homes in the area
Home Values in the Area
Average Home Value in this Area
Purchase History
| Date | Buyer | Sale Price | Title Company |
|---|---|---|---|
| Winn Arzo | -- | Rtt | |
| Cendant Mobility Financial Corp | -- | Rtt | |
| Wagnitz Trevor | -- | -- |
Source: Public Records
Mortgage History
| Date | Status | Borrower | Loan Amount |
|---|---|---|---|
| Open | Winn Arzo | $150,270 | |
| Previous Owner | Wagnitz Trevor | $161,579 |
Source: Public Records
Tax History Compared to Growth
Tax History
| Year | Tax Paid | Tax Assessment Tax Assessment Total Assessment is a certain percentage of the fair market value that is determined by local assessors to be the total taxable value of land and additions on the property. | Land | Improvement |
|---|---|---|---|---|
| 2025 | $5,657 | $417,720 | $135,000 | $282,720 |
| 2024 | $5,657 | $393,200 | $121,500 | $271,700 |
| 2023 | $5,657 | $393,200 | $121,500 | $271,700 |
| 2022 | $9,528 | $393,200 | $121,500 | $271,700 |
| 2021 | $7,448 | $284,510 | $77,000 | $207,510 |
| 2020 | $6,809 | $257,810 | $71,500 | $186,310 |
| 2019 | $7,409 | $257,810 | $71,500 | $186,310 |
| 2018 | $6,812 | $235,380 | $65,000 | $170,380 |
| 2017 | $6,830 | $235,380 | $65,000 | $170,380 |
| 2016 | $6,045 | $208,310 | $65,000 | $143,310 |
| 2015 | $3,663 | $182,840 | $65,000 | $117,840 |
| 2014 | $3,663 | $151,290 | $65,000 | $86,290 |
Source: Public Records
Map
Nearby Homes
- 10502 Augusta Ln
- 10702 Augusta Ln
- 10706 Augusta Ln
- 10618 Newcastleton Ln
- 10410 Augusta Ln
- 10606 Greenbriar Ln
- 10805 Winged Foot Dr
- 10310 Saint Georges Dr
- 3305 Elm Grove Rd
- 10205 Broadmoor Ln
- 10217 Broadmoor Ln
- 10006 Waterview Pkwy
- 10714 Waterview Pkwy
- 10205 Fairway Vista Dr
- 9506 Glenshee Dr
- 10014 Fairway Vista Dr
- 10302 Fairway Vista Dr
- 10601 Huffines Dr
- 9601 Waterview Pkwy
- 141 Kathlyn Ln
- 10709 Wolfcreek Ln
- 10717 Wolfcreek Ln
- 10705 Wolfcreek Ln
- 10601 Gleneagles Ln
- 10701 Wolfcreek Ln
- 10602 Gleneagles Ln
- 10605 Gleneagles Ln
- 10609 Gleneagles Ln
- 10617 Wolfcreek Ln
- 10606 Gleneagles Ln
- 10601 Lansdowne Ln
- 10613 Gleneagles Ln
- 10610 Gleneagles Ln
- 10613 Wolfcreek Ln
- 10605 Lansdowne Ln
- 10617 Gleneagles Ln
- 10614 Gleneagles Ln
- 10609 Wolfcreek Ln
- 10701 Gleneagles Ln
- 10602 Lansdowne Ln