Estimated Value: $221,000 - $227,257
3
Beds
2
Baths
1,231
Sq Ft
$182/Sq Ft
Est. Value
About This Home
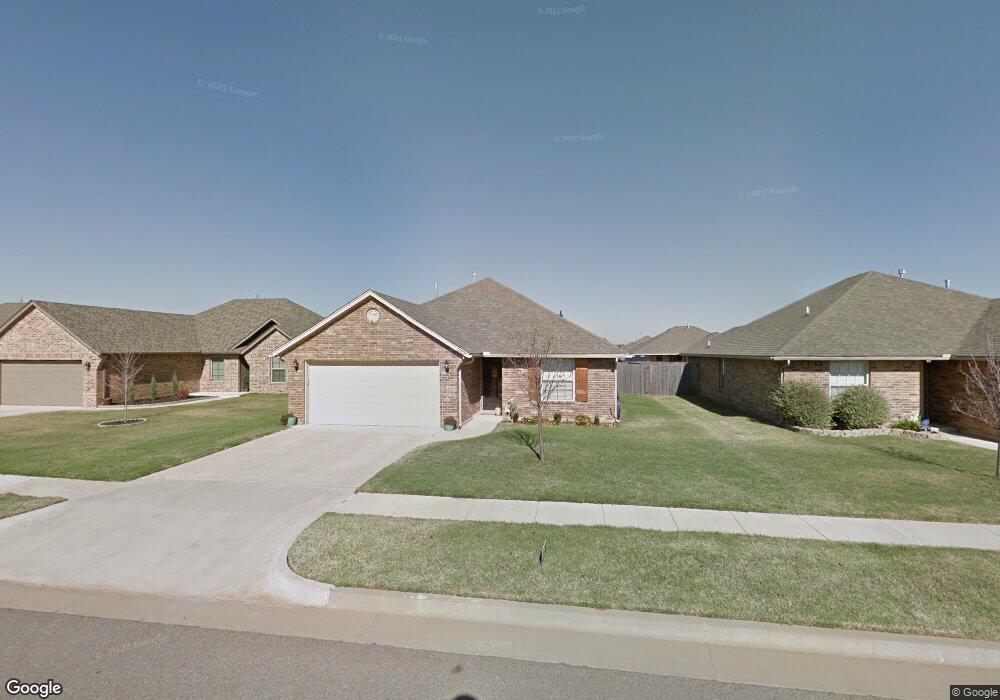
This home is located at 10717 SW 36th St, Yukon, OK 73099 and is currently estimated at $223,564, approximately $181 per square foot. 10717 SW 36th St is a home with nearby schools including Riverwood Elementary School, Canyon Ridge Intermediate School, and Mustang North Middle School.
Ownership History
Date
Name
Owned For
Owner Type
Purchase Details
Closed on
Jul 1, 2021
Sold by
Wilder Cody W and Wilder Sara
Bought by
Davis Joshua
Current Estimated Value
Home Financials for this Owner
Home Financials are based on the most recent Mortgage that was taken out on this home.
Original Mortgage
$144,300
Outstanding Balance
$130,930
Interest Rate
2.9%
Mortgage Type
New Conventional
Estimated Equity
$92,634
Purchase Details
Closed on
Nov 16, 2012
Sold by
Cornerstone Group Llc
Bought by
Wilder Cody W
Home Financials for this Owner
Home Financials are based on the most recent Mortgage that was taken out on this home.
Original Mortgage
$127,543
Interest Rate
3.5%
Mortgage Type
FHA
Purchase Details
Closed on
Apr 5, 2012
Sold by
Lightning Creek Development Llc
Home Financials for this Owner
Home Financials are based on the most recent Mortgage that was taken out on this home.
Original Mortgage
$100,640
Interest Rate
3.98%
Create a Home Valuation Report for This Property
The Home Valuation Report is an in-depth analysis detailing your home's value as well as a comparison with similar homes in the area
Home Values in the Area
Average Home Value in this Area
Purchase History
| Date | Buyer | Sale Price | Title Company |
|---|---|---|---|
| Davis Joshua | $190,000 | First American Title | |
| Wilder Cody W | $130,000 | American Eagle Title Group | |
| -- | $22,500 | -- |
Source: Public Records
Mortgage History
| Date | Status | Borrower | Loan Amount |
|---|---|---|---|
| Open | Davis Joshua | $144,300 | |
| Previous Owner | Wilder Cody W | $127,543 | |
| Previous Owner | -- | $100,640 |
Source: Public Records
Tax History Compared to Growth
Tax History
| Year | Tax Paid | Tax Assessment Tax Assessment Total Assessment is a certain percentage of the fair market value that is determined by local assessors to be the total taxable value of land and additions on the property. | Land | Improvement |
|---|---|---|---|---|
| 2024 | $2,447 | $22,692 | $2,760 | $19,932 |
| 2023 | $2,447 | $21,612 | $2,760 | $18,852 |
| 2022 | $2,366 | $20,583 | $2,760 | $17,823 |
| 2021 | $1,954 | $18,060 | $2,760 | $15,300 |
| 2020 | $1,913 | $17,534 | $2,760 | $14,774 |
| 2019 | $1,908 | $17,506 | $2,760 | $14,746 |
| 2018 | $1,883 | $16,996 | $2,760 | $14,236 |
| 2017 | $1,832 | $16,771 | $2,760 | $14,011 |
| 2016 | $1,771 | $16,283 | $2,760 | $13,523 |
| 2015 | -- | $15,832 | $2,760 | $13,072 |
| 2014 | -- | $15,826 | $2,940 | $12,886 |
Source: Public Records
Map
Nearby Homes
- 10621 SW 36th St
- 10628 SW 34th Terrace
- 10633 SW 34th Terrace
- 10609 SW 35th St
- 10624 SW 32nd St
- 11652 SW 12th St
- 10904 SW 32nd Terrace
- 3124 Copan Ct
- 10724 SW 30th St
- 3033 Sahoma Trail
- 10008 SW 38th St
- 3213 Open Prairie Trail
- 3317 Open Prairie Trail
- 2705 Tracy’s Manor
- 2705 Tracys Manor
- 12309 SW 32nd St
- 12313 SW 32nd St
- 12317 SW 32nd St
- 12321 SW 32nd St
- 12329 SW 32nd St
- 10713 SW 36th St
- 10721 SW 36th St
- 10709 SW 36th St
- 10725 SW 36th St
- 10716 SW 35th St
- 10712 SW 35th St
- 10720 SW 35th St
- 10720 SW 36th St
- 10716 SW 36th St
- 10729 SW 36th St
- 10712 SW 36th St
- 10708 SW 35th St
- 10724 SW 35th St
- 10724 SW 36th St
- 10708 SW 36th St
- 10704 SW 35th St
- 10728 SW 36th St
- 10733 SW 36th St
- 10701 SW 36th St
- 10704 SW 36th St