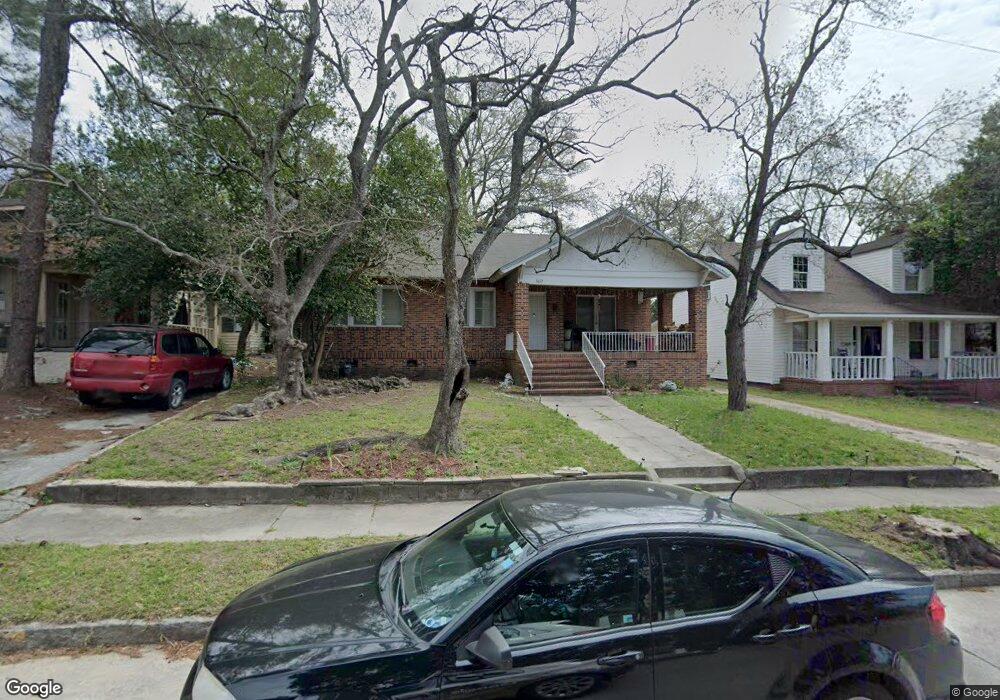
1072 Hillyer Ave Macon, GA 31204
Cherokee Heights Historic District NeighborhoodEstimated Value: $65,000 - $173,000
3
Beds
1
Bath
1,518
Sq Ft
$67/Sq Ft
Est. Value
About This Home
This home is located at 1072 Hillyer Ave, Macon, GA 31204 and is currently estimated at $102,367, approximately $67 per square foot. 1072 Hillyer Ave is a home located in Bibb County with nearby schools including Brookdale Elementary School, Miller Fine Arts Magnet Middle School, and Central High School.
Ownership History
Date
Name
Owned For
Owner Type
Purchase Details
Closed on
Feb 22, 2024
Sold by
Gates Clarence
Bought by
Jones Evelyn
Current Estimated Value
Purchase Details
Closed on
Jun 22, 2020
Sold by
Ga Realty Solutions Llc
Bought by
Gates Clarence and Jones Evelyn
Home Financials for this Owner
Home Financials are based on the most recent Mortgage that was taken out on this home.
Original Mortgage
$74,214
Interest Rate
3.2%
Mortgage Type
New Conventional
Purchase Details
Closed on
May 13, 2020
Sold by
Spear Alan G and Spear Laura S
Bought by
Southern Dreanscapes Llc
Home Financials for this Owner
Home Financials are based on the most recent Mortgage that was taken out on this home.
Original Mortgage
$74,214
Interest Rate
3.2%
Mortgage Type
New Conventional
Purchase Details
Closed on
Jun 15, 2017
Sold by
Hurst Mcintosh Lillian Denise and Hurst Hill Yulonda Moniki
Bought by
Spear Alan G
Purchase Details
Closed on
Aug 15, 2006
Bought by
Hurst Leroy
Create a Home Valuation Report for This Property
The Home Valuation Report is an in-depth analysis detailing your home's value as well as a comparison with similar homes in the area
Home Values in the Area
Average Home Value in this Area
Purchase History
| Date | Buyer | Sale Price | Title Company |
|---|---|---|---|
| Jones Evelyn | -- | None Listed On Document | |
| Gates Clarence | $79,990 | None Available | |
| Southern Dreanscapes Llc | -- | None Available | |
| Spear Alan G | $25,000 | None Available | |
| Hurst Leroy | -- | -- |
Source: Public Records
Mortgage History
| Date | Status | Borrower | Loan Amount |
|---|---|---|---|
| Previous Owner | Gates Clarence | $74,214 |
Source: Public Records
Tax History Compared to Growth
Tax History
| Year | Tax Paid | Tax Assessment Tax Assessment Total Assessment is a certain percentage of the fair market value that is determined by local assessors to be the total taxable value of land and additions on the property. | Land | Improvement |
|---|---|---|---|---|
| 2025 | $724 | $29,460 | $3,360 | $26,100 |
| 2024 | $748 | $29,460 | $3,360 | $26,100 |
| 2023 | $694 | $27,319 | $2,640 | $24,679 |
| 2022 | $794 | $22,930 | $4,297 | $18,633 |
| 2021 | $618 | $16,275 | $2,793 | $13,482 |
| 2020 | $609 | $15,690 | $2,793 | $12,897 |
| 2019 | $614 | $15,690 | $2,793 | $12,897 |
| 2018 | $1,121 | $15,690 | $2,793 | $12,897 |
| 2017 | $588 | $15,690 | $2,793 | $12,897 |
| 2016 | $591 | $17,091 | $2,793 | $14,298 |
| 2015 | $493 | $17,091 | $2,793 | $14,298 |
| 2014 | $603 | $17,091 | $2,793 | $14,298 |
Source: Public Records
Map
Nearby Homes
- 2686 Napier Ave
- 1198 Winton Ave
- 2773 Beech Ave
- 1198 Brentwood Ave
- 2696 Suwanee Ave
- 2534 Napier Ave
- 1171 Brentwood Ave
- 1285 Pio Nono Ave
- 1195 Brentwood Ave
- 2713 Suwanee Ave
- 1340 Courtland Ave
- 2497 Napier Ave
- 2723 Roy St
- 2711 Roy St
- 2485 Beech Ave
- 2753 Roy St
- 1062 Bartlett St
- 2793 Suwanee Ave
- 2435 Napier Ave
- 1060 Hillyer Ave
- 1084 Hillyer Ave
- 1048 Hillyer Ave
- 2697 Napier Ave
- 2677 Napier Ave
- 1036 Hillyer Ave
- 1061 Hillyer Ave
- 1085 Hillyer Ave
- 1049 Hillyer Ave
- 1097 Hillyer Ave
- 1073 Hillyer Ave
- 1024 Hillyer Ave
- 1037 Hillyer Ave
- 2671 Napier Ave
- 1012 Hillyer Ave
- 1025 Hillyer Ave
- 2692 Napier Ave
- 1075 Courtland Ave
- 1013 Hillyer Ave
- 2680 Napier Ave