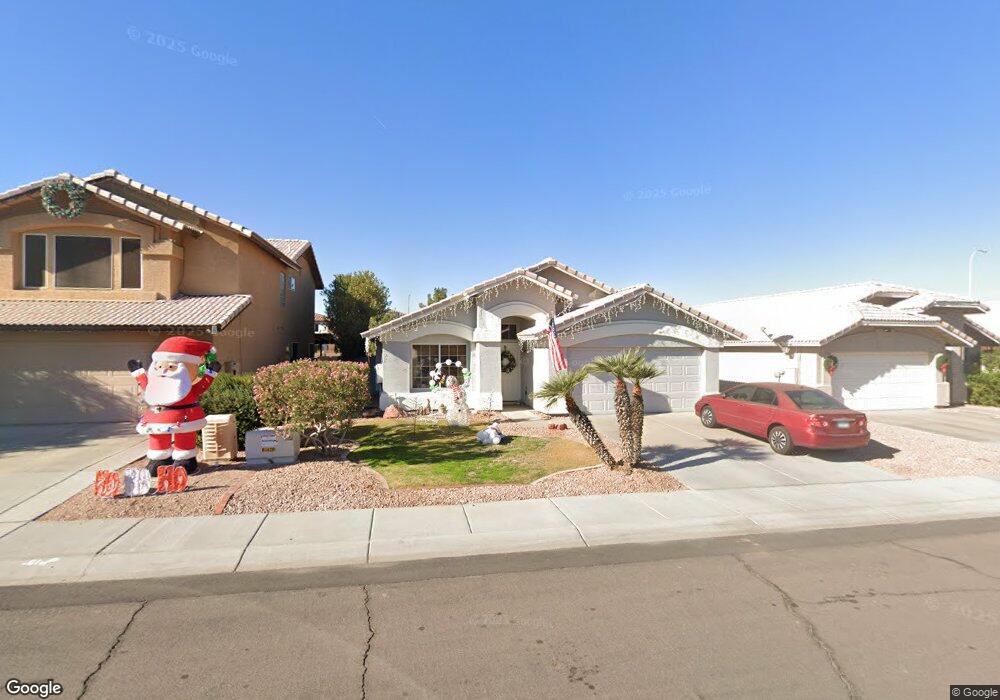
1072 N Hudson Place Chandler, AZ 85225
The Islands NeighborhoodEstimated Value: $457,091 - $496,000
3
Beds
2
Baths
1,599
Sq Ft
$298/Sq Ft
Est. Value
About This Home
This home is located at 1072 N Hudson Place, Chandler, AZ 85225 and is currently estimated at $476,273, approximately $297 per square foot. 1072 N Hudson Place is a home located in Maricopa County with nearby schools including Shumway Elementary School, Willis Junior High School, and Chandler High School.
Ownership History
Date
Name
Owned For
Owner Type
Purchase Details
Closed on
Aug 19, 2016
Sold by
Dearing Christine M
Bought by
Dearing Christine M and Chris Family Trust
Current Estimated Value
Purchase Details
Closed on
Nov 19, 2015
Sold by
Pagel Thomas A and Pagel Revocable Trust
Bought by
Carney George F and Carney Sally G
Home Financials for this Owner
Home Financials are based on the most recent Mortgage that was taken out on this home.
Original Mortgage
$308,867
Outstanding Balance
$242,276
Interest Rate
3.71%
Mortgage Type
New Conventional
Estimated Equity
$233,997
Purchase Details
Closed on
May 26, 2010
Sold by
Dearing James J
Bought by
Dearing Christine M
Home Financials for this Owner
Home Financials are based on the most recent Mortgage that was taken out on this home.
Original Mortgage
$109,875
Interest Rate
5.03%
Mortgage Type
New Conventional
Purchase Details
Closed on
May 24, 2010
Sold by
Lenox Matt and Lenox Brittney F
Bought by
Dearing Christine M
Home Financials for this Owner
Home Financials are based on the most recent Mortgage that was taken out on this home.
Original Mortgage
$109,875
Interest Rate
5.03%
Mortgage Type
New Conventional
Purchase Details
Closed on
Mar 27, 2007
Sold by
Ikeda Mark M
Bought by
Lenox Matt and Kreese Brittany Fawn
Home Financials for this Owner
Home Financials are based on the most recent Mortgage that was taken out on this home.
Original Mortgage
$254,998
Interest Rate
6.29%
Mortgage Type
FHA
Purchase Details
Closed on
Dec 1, 1998
Sold by
Scott Thomas G
Bought by
Ikeda Mark M
Home Financials for this Owner
Home Financials are based on the most recent Mortgage that was taken out on this home.
Original Mortgage
$114,723
Interest Rate
6.78%
Mortgage Type
FHA
Purchase Details
Closed on
Apr 2, 1996
Sold by
Mccune Susan M and Munson Susan M
Bought by
Scott Thomas G
Home Financials for this Owner
Home Financials are based on the most recent Mortgage that was taken out on this home.
Original Mortgage
$40,000
Interest Rate
7.41%
Mortgage Type
New Conventional
Purchase Details
Closed on
Apr 20, 1994
Sold by
Fulton Homes Corp
Bought by
Munson Susan M
Home Financials for this Owner
Home Financials are based on the most recent Mortgage that was taken out on this home.
Original Mortgage
$93,252
Interest Rate
7.67%
Mortgage Type
FHA
Create a Home Valuation Report for This Property
The Home Valuation Report is an in-depth analysis detailing your home's value as well as a comparison with similar homes in the area
Home Values in the Area
Average Home Value in this Area
Purchase History
| Date | Buyer | Sale Price | Title Company |
|---|---|---|---|
| Dearing Christine M | -- | None Available | |
| Carney George F | $299,000 | Driggs Title Agency Inc | |
| Dearing Christine M | -- | Equity Title Agency Inc | |
| Dearing Christine M | $146,500 | Equity Title Agency Inc | |
| Lenox Matt | $259,000 | Fidelity National Title | |
| Ikeda Mark M | $122,500 | First American Title | |
| Scott Thomas G | $115,000 | Stewart Title & Trust | |
| Munson Susan M | $93,983 | Security Title Agency |
Source: Public Records
Mortgage History
| Date | Status | Borrower | Loan Amount |
|---|---|---|---|
| Open | Carney George F | $308,867 | |
| Previous Owner | Dearing Christine M | $109,875 | |
| Previous Owner | Dearing Christine M | $109,875 | |
| Previous Owner | Lenox Matt | $254,998 | |
| Previous Owner | Ikeda Mark M | $114,723 | |
| Previous Owner | Scott Thomas G | $40,000 | |
| Previous Owner | Munson Susan M | $93,252 |
Source: Public Records
Tax History Compared to Growth
Tax History
| Year | Tax Paid | Tax Assessment Tax Assessment Total Assessment is a certain percentage of the fair market value that is determined by local assessors to be the total taxable value of land and additions on the property. | Land | Improvement |
|---|---|---|---|---|
| 2025 | $1,638 | $21,034 | -- | -- |
| 2024 | $1,583 | $20,032 | -- | -- |
| 2023 | $1,583 | $33,050 | $6,610 | $26,440 |
| 2022 | $1,527 | $24,860 | $4,970 | $19,890 |
| 2021 | $1,600 | $23,720 | $4,740 | $18,980 |
| 2020 | $1,593 | $21,770 | $4,350 | $17,420 |
| 2019 | $1,532 | $20,260 | $4,050 | $16,210 |
| 2018 | $1,484 | $18,800 | $3,760 | $15,040 |
| 2017 | $1,383 | $17,330 | $3,460 | $13,870 |
| 2016 | $1,332 | $17,000 | $3,400 | $13,600 |
| 2015 | $1,291 | $15,660 | $3,130 | $12,530 |
Source: Public Records
Map
Nearby Homes
- 941 N Adams Ct
- 1691 E Gary Dr
- 1302 N Bedford Dr
- 1590 E Robinson Way
- 1014 E Golden Ct
- 791 N Velero St
- 1853 E Shannon St
- 860 N Mcqueen Rd Unit 1163
- 1126 N Melody Cir
- 872 E Baylor Ln
- 1214 W Iris Dr
- 955 E Knox Rd Unit 110
- 955 E Knox Rd Unit 137
- 1951 E Baylor Ct
- 865 E Del Rio St
- 932 E Manor Dr
- 896 N Layman St
- 642 N Danyell Ct
- 938 W Iris Dr
- 853 E Manor Dr
- 1062 N Hudson Place
- 1082 N Hudson Place
- 1052 N Hudson Place
- 1092 N Hudson Place
- 1092 N Hudson Place Unit >
- 1042 N Hudson Place
- 1363 E Constitution Dr
- 1032 N Hudson Place
- 1081 N Mason Dr
- 1071 N Mason Dr
- 1102 N Hudson Place
- 1061 N Mason Dr
- 1372 E Constitution Dr
- 1373 E Constitution Dr
- 1051 N Mason Dr
- 1022 N Hudson Place
- 1112 N Hudson Place
- 1360 E Gary Dr
- 1041 N Mason Dr
- 1382 E Constitution Dr