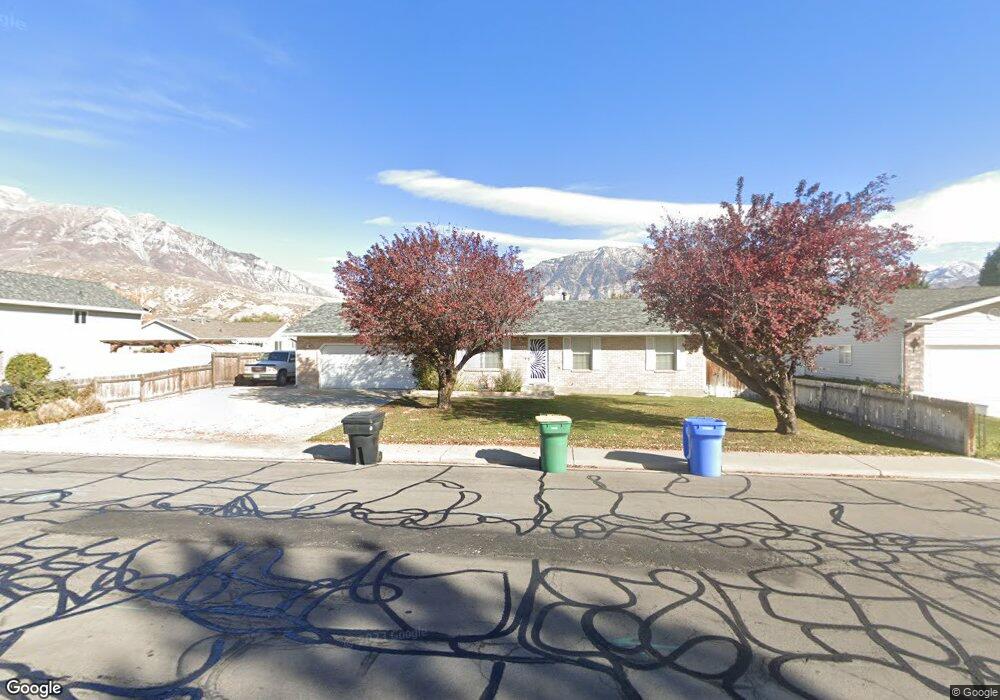
1072 N Main St Orem, UT 84057
Windsor NeighborhoodEstimated Value: $466,000 - $478,922
3
Beds
1
Bath
1,040
Sq Ft
$453/Sq Ft
Est. Value
About This Home
This home is located at 1072 N Main St, Orem, UT 84057 and is currently estimated at $471,307, approximately $453 per square foot. 1072 N Main St is a home located in Utah County with nearby schools including Windsor School, Canyon View Junior High School, and Timpanogos High School.
Ownership History
Date
Name
Owned For
Owner Type
Purchase Details
Closed on
Jan 24, 2012
Sold by
Snell Julie Ann
Bought by
Snell Gene M
Current Estimated Value
Purchase Details
Closed on
Mar 24, 2008
Sold by
Snell Gene M and Snell Julie A
Bought by
Snell Gene M
Home Financials for this Owner
Home Financials are based on the most recent Mortgage that was taken out on this home.
Original Mortgage
$166,000
Outstanding Balance
$103,304
Interest Rate
5.72%
Mortgage Type
New Conventional
Estimated Equity
$368,003
Purchase Details
Closed on
Apr 20, 2005
Sold by
Collett Owen Jeffrey
Bought by
Mitchell Todd H
Purchase Details
Closed on
Oct 10, 2002
Sold by
Snell Julie A
Bought by
Snell Gene M and Snell Julie A
Home Financials for this Owner
Home Financials are based on the most recent Mortgage that was taken out on this home.
Original Mortgage
$64,500
Interest Rate
6.05%
Create a Home Valuation Report for This Property
The Home Valuation Report is an in-depth analysis detailing your home's value as well as a comparison with similar homes in the area
Home Values in the Area
Average Home Value in this Area
Purchase History
| Date | Buyer | Sale Price | Title Company |
|---|---|---|---|
| Snell Gene M | -- | First American Orem | |
| Snell Gene M | -- | First American Orem | |
| Mitchell Todd H | -- | Security Title & Abstract | |
| Snell Gene M | -- | Liberty Title | |
| Snell Julie A | -- | Liberty Title |
Source: Public Records
Mortgage History
| Date | Status | Borrower | Loan Amount |
|---|---|---|---|
| Open | Snell Gene M | $166,000 | |
| Previous Owner | Snell Julie A | $64,500 |
Source: Public Records
Tax History
| Year | Tax Paid | Tax Assessment Tax Assessment Total Assessment is a certain percentage of the fair market value that is determined by local assessors to be the total taxable value of land and additions on the property. | Land | Improvement |
|---|---|---|---|---|
| 2025 | $1,993 | $253,165 | -- | -- |
| 2024 | $1,864 | $243,650 | $0 | $0 |
| 2023 | $1,864 | $244,970 | $0 | $0 |
| 2022 | $1,994 | $253,825 | $0 | $0 |
| 2021 | $1,671 | $322,200 | $146,100 | $176,100 |
| 2020 | $1,527 | $289,500 | $116,900 | $172,600 |
| 2019 | $1,413 | $278,500 | $105,900 | $172,600 |
| 2018 | $1,340 | $252,400 | $102,300 | $150,100 |
| 2017 | $1,281 | $129,195 | $0 | $0 |
| 2016 | $1,180 | $109,780 | $0 | $0 |
| 2015 | $1,203 | $105,820 | $0 | $0 |
| 2014 | $1,196 | $104,775 | $0 | $0 |
Source: Public Records
Map
Nearby Homes
- 16 E 925 N
- 917 N Garden Dr
- 125 W 870 N
- 789 200 E Unit 787
- 372 E 1165 N
- 287 W 1380 N
- 1371 N 330 E Unit 8
- 332 W Amiron Way Unit D
- 363 E 1395 N Unit 22
- 362 E 800 N Unit 1
- 620 N 120 E
- 1461 N Amiron Way Unit B
- 1548 N 275 West St Unit 2
- 538 W 1120 N
- 1566 N 275 West St Unit 1
- 597 N State St Unit 25
- 1547 N 275 West St Unit 5
- 1480 N 430 E
- 1244 N 580 W
- 531 W 1350 N
Your Personal Tour Guide
Ask me questions while you tour the home.