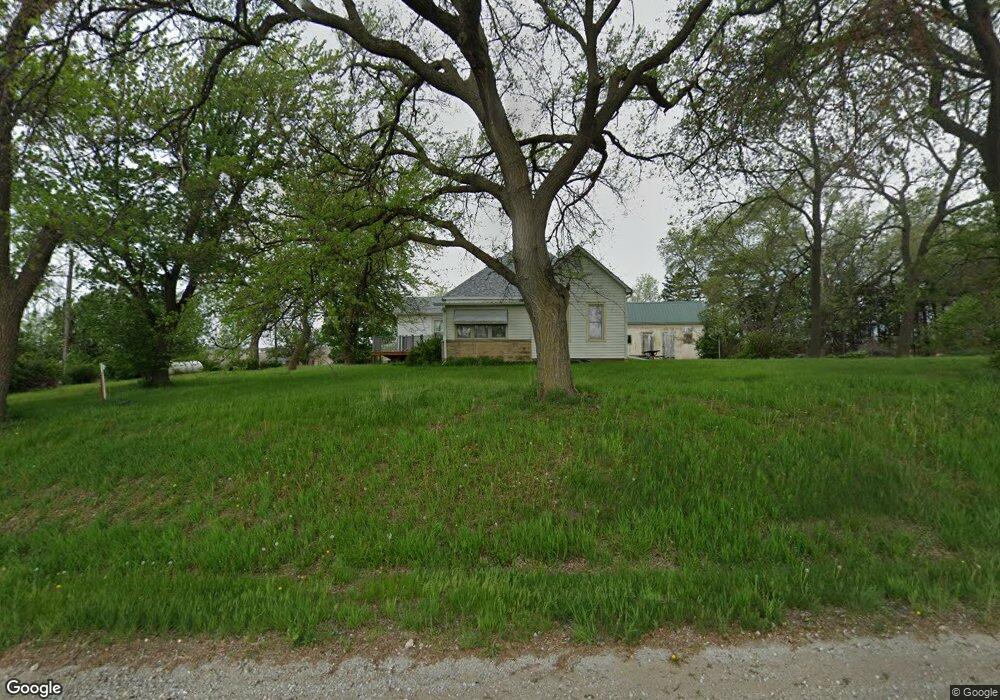
1072 S 48th Rd Dunbar, NE 68346
Estimated Value: $224,000 - $339,602
3
Beds
2
Baths
1,336
Sq Ft
$206/Sq Ft
Est. Value
About This Home
This home is located at 1072 S 48th Rd, Dunbar, NE 68346 and is currently estimated at $275,651, approximately $206 per square foot. 1072 S 48th Rd is a home located in Otoe County with nearby schools including Johnson County Central Elementary School - Cook, Johnson County Central Elementary School - Tecumseh, and Johnson County Central Middle School.
Ownership History
Date
Name
Owned For
Owner Type
Purchase Details
Closed on
Feb 7, 2024
Sold by
Wellensiek Roger P
Bought by
Shudak Jacob T and Shudak Courtney N
Current Estimated Value
Home Financials for this Owner
Home Financials are based on the most recent Mortgage that was taken out on this home.
Original Mortgage
$174,400
Outstanding Balance
$171,347
Interest Rate
6.66%
Mortgage Type
New Conventional
Estimated Equity
$104,304
Create a Home Valuation Report for This Property
The Home Valuation Report is an in-depth analysis detailing your home's value as well as a comparison with similar homes in the area
Home Values in the Area
Average Home Value in this Area
Purchase History
| Date | Buyer | Sale Price | Title Company |
|---|---|---|---|
| Shudak Jacob T | $218,000 | None Listed On Document |
Source: Public Records
Mortgage History
| Date | Status | Borrower | Loan Amount |
|---|---|---|---|
| Open | Shudak Jacob T | $174,400 |
Source: Public Records
Tax History Compared to Growth
Tax History
| Year | Tax Paid | Tax Assessment Tax Assessment Total Assessment is a certain percentage of the fair market value that is determined by local assessors to be the total taxable value of land and additions on the property. | Land | Improvement |
|---|---|---|---|---|
| 2024 | $3,024 | $229,555 | $57,596 | $171,959 |
| 2023 | $1,170 | $208,686 | $52,360 | $156,326 |
| 2022 | $510 | $164,410 | $52,360 | $112,050 |
| 2021 | $387 | $164,410 | $52,360 | $112,050 |
| 2020 | $580 | $156,840 | $44,790 | $112,050 |
| 2019 | $303 | $146,660 | $44,790 | $101,870 |
| 2018 | $287 | $142,660 | $40,790 | $101,870 |
| 2017 | $1,801 | $142,660 | $40,790 | $101,870 |
| 2016 | $613 | $94,280 | $40,790 | $53,490 |
| 2015 | $177 | $93,960 | $40,470 | $53,490 |
| 2014 | $548 | $92,040 | $38,550 | $53,490 |
| 2012 | $572 | $88,560 | $35,070 | $53,490 |
Source: Public Records
Map
Nearby Homes