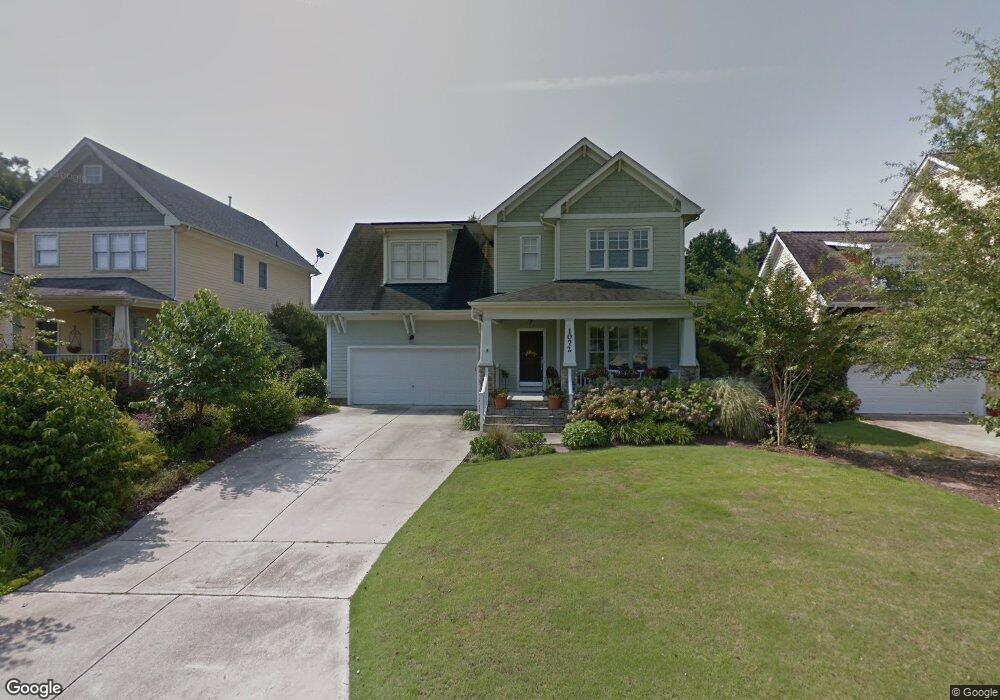
1072 Trentini Ave Wake Forest, NC 27587
Estimated Value: $468,000 - $535,000
3
Beds
3
Baths
2,262
Sq Ft
$223/Sq Ft
Est. Value
About This Home
This home is located at 1072 Trentini Ave, Wake Forest, NC 27587 and is currently estimated at $503,964, approximately $222 per square foot. 1072 Trentini Ave is a home located in Wake County with nearby schools including Heritage Elementary School, Heritage Middle School, and Heritage High School.
Ownership History
Date
Name
Owned For
Owner Type
Purchase Details
Closed on
Jul 16, 2021
Sold by
Barber Lisa M and Murphy Usa
Bought by
Barber Lisa M
Current Estimated Value
Home Financials for this Owner
Home Financials are based on the most recent Mortgage that was taken out on this home.
Original Mortgage
$245,000
Outstanding Balance
$151,457
Interest Rate
2.9%
Mortgage Type
New Conventional
Estimated Equity
$352,507
Purchase Details
Closed on
Aug 22, 2014
Sold by
Murphy Kevin and Murphy Lisa
Bought by
Murphy Lisa
Purchase Details
Closed on
Dec 19, 2003
Sold by
Mcneill Burbank Homes Llc
Bought by
Murphy Kevin and Murphy Lisa
Home Financials for this Owner
Home Financials are based on the most recent Mortgage that was taken out on this home.
Original Mortgage
$216,751
Interest Rate
5.12%
Mortgage Type
Purchase Money Mortgage
Purchase Details
Closed on
Oct 6, 2003
Sold by
Heritage Wake Forest Inc
Bought by
Mcneill Burbank Homes Llc
Create a Home Valuation Report for This Property
The Home Valuation Report is an in-depth analysis detailing your home's value as well as a comparison with similar homes in the area
Home Values in the Area
Average Home Value in this Area
Purchase History
| Date | Buyer | Sale Price | Title Company |
|---|---|---|---|
| Barber Lisa M | -- | None Available | |
| Murphy Lisa | -- | None Available | |
| Murphy Kevin | $228,500 | -- | |
| Mcneill Burbank Homes Llc | $376,000 | -- |
Source: Public Records
Mortgage History
| Date | Status | Borrower | Loan Amount |
|---|---|---|---|
| Open | Barber Lisa M | $245,000 | |
| Closed | Murphy Kevin | $216,751 |
Source: Public Records
Tax History Compared to Growth
Tax History
| Year | Tax Paid | Tax Assessment Tax Assessment Total Assessment is a certain percentage of the fair market value that is determined by local assessors to be the total taxable value of land and additions on the property. | Land | Improvement |
|---|---|---|---|---|
| 2025 | $3,984 | $410,123 | $100,000 | $310,123 |
| 2024 | $3,970 | $410,123 | $100,000 | $310,123 |
| 2023 | $3,607 | $308,691 | $65,000 | $243,691 |
| 2022 | $3,460 | $308,691 | $65,000 | $243,691 |
| 2021 | $3,400 | $308,691 | $65,000 | $243,691 |
| 2020 | $3,400 | $308,691 | $65,000 | $243,691 |
| 2019 | $3,194 | $255,844 | $50,000 | $205,844 |
| 2018 | $3,025 | $255,844 | $50,000 | $205,844 |
| 2017 | $2,924 | $255,844 | $50,000 | $205,844 |
| 2016 | $2,887 | $255,844 | $50,000 | $205,844 |
| 2015 | $3,039 | $266,149 | $50,000 | $216,149 |
| 2014 | $2,942 | $266,149 | $50,000 | $216,149 |
Source: Public Records
Map
Nearby Homes
- 1101 Trentini Ave
- 1713 Thicketon Cir
- 916 Overlook Ridge Rd
- 1617 Heritage Garden St
- 1504 Eppes Ln
- 1308 Groves Field Ln
- 1300 Heritage Club Ave
- 236 Simwood Ave
- 308 Simwood Ave
- 3807 Heritage Spring Cir
- 1608 Heritage Links Dr
- Tupelo Plan at Forestville Towns
- Hawthorne Plan at Forestville Towns
- Twinberry Plan at Forestville Towns
- 1508 Pointon Way
- 6633 Penfield St
- 557 Forestville Rd
- 555 Forestville Rd
- 816 Lilyquist Way
- 553 Forestville Rd
- 1068 Trentini Ave
- 1080 Trentini Ave
- 1077 Trentini Ave
- 877 Trentini Ave
- 1084 Trentini Ave
- 1073 Trentini Ave
- 1081 Trentini Ave
- 1085 Trentini Ave
- 1088 Trentini Ave
- 1089 Trentini Ave
- 1092 Trentini Ave
- 1096 Trentini Ave
- 873 Stroud Cir
- 916 Sugar Gap Rd
- 869 Stroud Cir
- 1100 Trentini Ave
- 1105 Trentini Ave
- 1104 Trentini Ave
- 865 Stroud Cir
- 1109 Trentini Ave