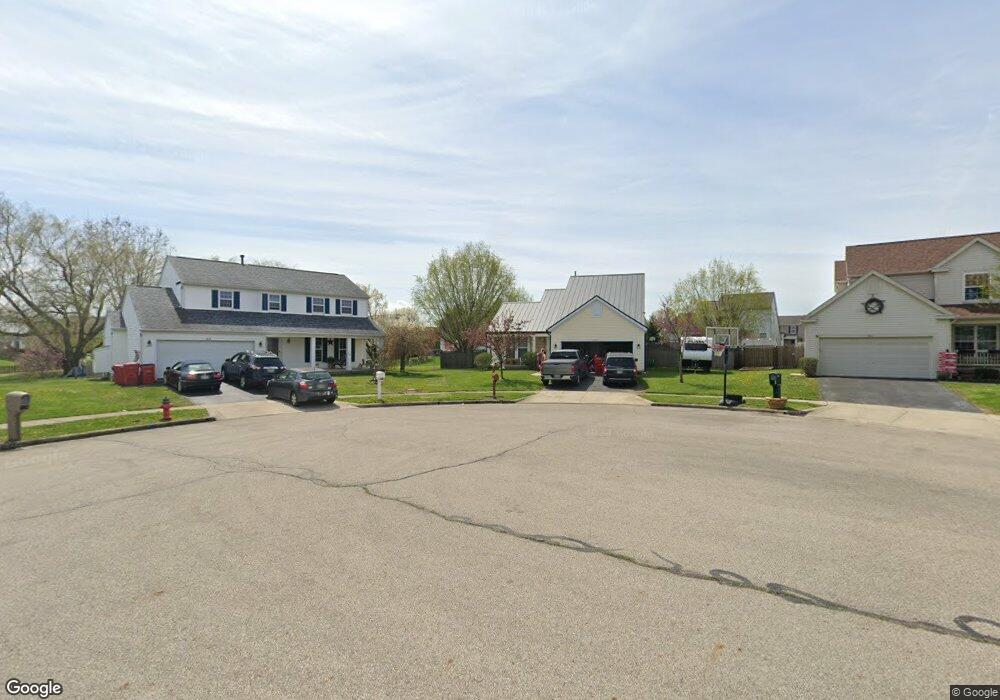
1072 Wilshire Ct London, OH 43140
Estimated Value: $298,399 - $322,000
3
Beds
2
Baths
1,510
Sq Ft
$207/Sq Ft
Est. Value
About This Home
This home is located at 1072 Wilshire Ct, London, OH 43140 and is currently estimated at $313,100, approximately $207 per square foot. 1072 Wilshire Ct is a home located in Madison County with nearby schools including London Elementary School, London Middle School, and London High School.
Ownership History
Date
Name
Owned For
Owner Type
Purchase Details
Closed on
Jun 23, 2015
Sold by
Faulkner Christina N and Faulkner Thomas N
Bought by
Steffanni Brett and Steffanni Christina
Current Estimated Value
Home Financials for this Owner
Home Financials are based on the most recent Mortgage that was taken out on this home.
Original Mortgage
$129,600
Outstanding Balance
$98,555
Interest Rate
3.25%
Mortgage Type
Adjustable Rate Mortgage/ARM
Estimated Equity
$214,545
Purchase Details
Closed on
Oct 24, 2001
Sold by
Sovereign Dev Corp
Bought by
Faulkner Thomas N
Home Financials for this Owner
Home Financials are based on the most recent Mortgage that was taken out on this home.
Original Mortgage
$165,829
Interest Rate
6.88%
Mortgage Type
FHA
Purchase Details
Closed on
Jun 23, 2000
Sold by
Community Dev Co
Bought by
Sovereign Dev Corp
Home Financials for this Owner
Home Financials are based on the most recent Mortgage that was taken out on this home.
Original Mortgage
$837,828
Interest Rate
8.56%
Mortgage Type
New Conventional
Create a Home Valuation Report for This Property
The Home Valuation Report is an in-depth analysis detailing your home's value as well as a comparison with similar homes in the area
Home Values in the Area
Average Home Value in this Area
Purchase History
| Date | Buyer | Sale Price | Title Company |
|---|---|---|---|
| Steffanni Brett | $162,000 | Stewart Title | |
| Faulkner Thomas N | $167,140 | -- | |
| Sovereign Dev Corp | $224,000 | -- |
Source: Public Records
Mortgage History
| Date | Status | Borrower | Loan Amount |
|---|---|---|---|
| Open | Steffanni Brett | $129,600 | |
| Previous Owner | Faulkner Thomas N | $165,829 | |
| Previous Owner | Sovereign Dev Corp | $837,828 |
Source: Public Records
Tax History Compared to Growth
Tax History
| Year | Tax Paid | Tax Assessment Tax Assessment Total Assessment is a certain percentage of the fair market value that is determined by local assessors to be the total taxable value of land and additions on the property. | Land | Improvement |
|---|---|---|---|---|
| 2024 | $2,602 | $85,080 | $16,990 | $68,090 |
| 2023 | $2,602 | $85,080 | $16,990 | $68,090 |
| 2022 | $2,032 | $60,770 | $12,130 | $48,640 |
| 2021 | $2,023 | $60,770 | $12,130 | $48,640 |
| 2020 | $2,024 | $60,770 | $12,130 | $48,640 |
| 2019 | $1,788 | $53,120 | $10,480 | $42,640 |
| 2018 | $1,945 | $53,120 | $10,480 | $42,640 |
| 2017 | $1,912 | $53,120 | $10,480 | $42,640 |
| 2016 | $1,881 | $53,120 | $10,480 | $42,640 |
| 2015 | $1,868 | $53,120 | $10,480 | $42,640 |
| 2014 | $2,153 | $53,120 | $10,480 | $42,640 |
| 2013 | -- | $45,920 | $12,600 | $33,320 |
Source: Public Records
Map
Nearby Homes
- 1070 Wilshire Ct
- 0 Keny Blvd Unit 225008830
- 1039 Amherst Blvd
- 1063 Hartford Ln
- 1028 Amherst Blvd
- 1095 Hartford Ln
- 1099 Hartford Ln
- 1252 Eagleton Blvd
- Sienna Plan at Johnson's Creek
- Harmony Plan at Johnson's Creek
- Bellamy Plan at Johnson's Creek
- Lyndhurst Plan at Johnson's Creek
- Stamford Plan at Johnson's Creek
- Pendleton Plan at Johnson's Creek
- Chatham Plan at Johnson's Creek
- Henley Plan at Johnson's Creek
- 1103 Hartford Ln
- 1123 Hampton Ln
- 1154 Hampton Ln
- Lot 3 Jacksonville Rd
- 1074 Wilshire Ct
- 1014 Margate Cir
- 1016 Margate Cir
- 1014 Margate Dr
- 1018 Margate Cir
- 1076 Wilshire Ct
- 1068 Wilshire Ct
- 1010 Margate Cir
- 1020 Margate Cir
- 1066 Wilshire Ct
- 1064 Wilshire Ct
- 1062 Wilshire Ct
- 1008 Margate Cir
- 1017 Margate Dr
- 1013 Margate Cir
- 1015 Margate Cir
- 1011 Margate Cir
- 1017 Margate Cir
- 1020 Ansley Ct