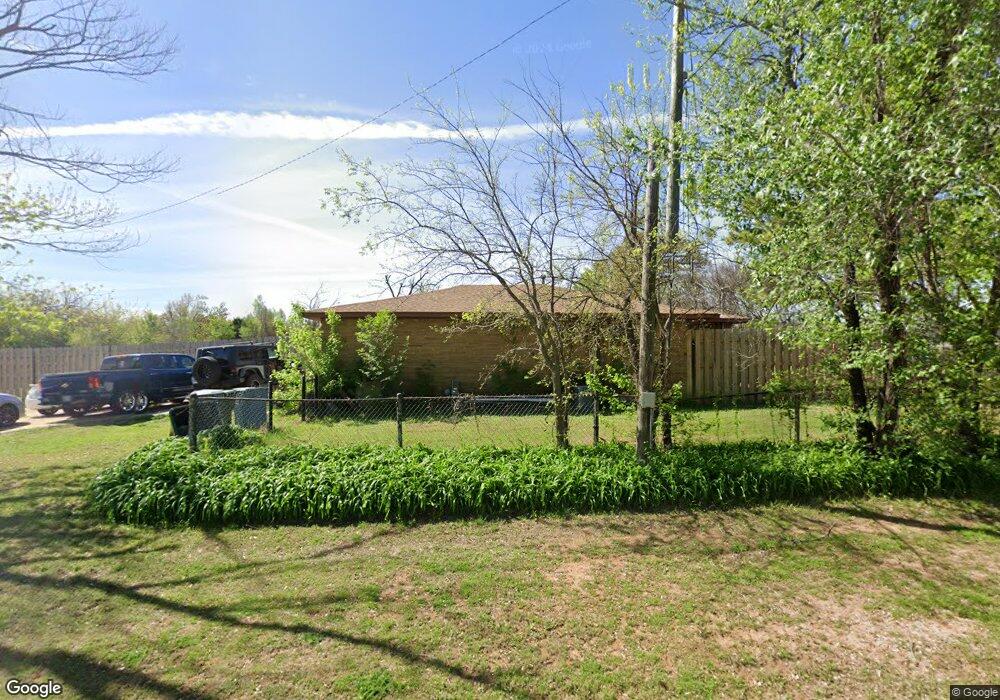
10720 Bellview Dr Oklahoma City, OK 73130
Estimated Value: $183,000 - $204,000
3
Beds
2
Baths
1,380
Sq Ft
$139/Sq Ft
Est. Value
About This Home
This home is located at 10720 Bellview Dr, Oklahoma City, OK 73130 and is currently estimated at $192,022, approximately $139 per square foot. 10720 Bellview Dr is a home located in Oklahoma County with nearby schools including Nicoma Park Elementary School, Nicoma Park Intermediate Elementary School, and Nicoma Park Middle School.
Ownership History
Date
Name
Owned For
Owner Type
Purchase Details
Closed on
May 29, 2014
Sold by
Martin Mary E
Bought by
Biggerstaff John A
Current Estimated Value
Home Financials for this Owner
Home Financials are based on the most recent Mortgage that was taken out on this home.
Original Mortgage
$115,567
Outstanding Balance
$88,494
Interest Rate
4.38%
Mortgage Type
FHA
Estimated Equity
$103,528
Purchase Details
Closed on
Jun 22, 2010
Sold by
Dequasie Greg and Dequasie Kristen
Bought by
Martin Mary E
Home Financials for this Owner
Home Financials are based on the most recent Mortgage that was taken out on this home.
Original Mortgage
$101,631
Interest Rate
4.87%
Mortgage Type
FHA
Purchase Details
Closed on
Feb 16, 2010
Sold by
Lad Dequasie Properties Llc
Bought by
Dequasie Greg
Purchase Details
Closed on
Nov 4, 2009
Sold by
Mary J Welch Revocable Trust
Bought by
Lad Dequasie Properties Llc
Purchase Details
Closed on
Nov 13, 2001
Sold by
Welch Mary J
Bought by
Welch Mary J and The Mary J Welch Revocable Trust
Create a Home Valuation Report for This Property
The Home Valuation Report is an in-depth analysis detailing your home's value as well as a comparison with similar homes in the area
Home Values in the Area
Average Home Value in this Area
Purchase History
| Date | Buyer | Sale Price | Title Company |
|---|---|---|---|
| Biggerstaff John A | $118,000 | Fatco | |
| Martin Mary E | $103,000 | Capitol Abstract & Title | |
| Dequasie Greg | -- | Old Republic Title Co Of Ok | |
| Lad Dequasie Properties Llc | $34,500 | American Guaranty Title Co | |
| Welch Mary J | -- | -- |
Source: Public Records
Mortgage History
| Date | Status | Borrower | Loan Amount |
|---|---|---|---|
| Open | Biggerstaff John A | $115,567 | |
| Previous Owner | Martin Mary E | $101,631 |
Source: Public Records
Tax History Compared to Growth
Tax History
| Year | Tax Paid | Tax Assessment Tax Assessment Total Assessment is a certain percentage of the fair market value that is determined by local assessors to be the total taxable value of land and additions on the property. | Land | Improvement |
|---|---|---|---|---|
| 2024 | $1,963 | $16,044 | $3,092 | $12,952 |
| 2023 | $1,963 | $15,280 | $3,085 | $12,195 |
| 2022 | $1,851 | $14,553 | $3,215 | $11,338 |
| 2021 | $1,756 | $13,860 | $4,349 | $9,511 |
| 2020 | $1,685 | $13,200 | $2,494 | $10,706 |
| 2019 | $1,859 | $14,726 | $1,960 | $12,766 |
| 2018 | $1,678 | $14,025 | $0 | $0 |
| 2017 | $1,657 | $13,859 | $1,976 | $11,883 |
| 2016 | $1,609 | $13,341 | $1,941 | $11,400 |
| 2015 | $1,587 | $12,705 | $2,393 | $10,312 |
| 2014 | $1,304 | $11,387 | $2,393 | $8,994 |
Source: Public Records
Map
Nearby Homes
- 10813 SE 9th St
- 10800 SE 9th St
- 1104 Victor Ct
- 10505 Willow Ridge Dr
- 10820 Ohara Ln
- 1301 Grand Manor
- 10305 Saint Patrick Dr
- 11101 E Reno Ave
- 000 Tbd Bellview Dr
- 10236 Bellmont Ave
- 0 SE 15th St
- 104 Stone Creek Rd
- 1501 S Avery Ave
- 313 Remington Ave
- 11030 Madison Ave
- 10107 Saint Patrick Dr
- 10323 Haven Cir
- 1972 Leslie Beachler Ln
- 1917 Goldenrod Ln
- 11375 E Reno Ave
- 10722 Bellview Dr
- 10716 Bellview Dr
- 10712 Bellview Dr
- 10725 Bellview Dr
- 10723 Bellview Dr
- 10733 Bellview Dr
- 10629 Willow Ridge Dr
- 904 Choctaw Ridge Rd
- 10721 Bellview Dr
- 10700 Bellview Dr
- 10801 Bellview Dr
- 908 Choctaw Ridge Rd
- 10808 Bellview Dr
- 10625 Willow Ridge Dr
- 10724 Lejean Dr
- 10720 Lejean Dr
- 10701 Bellview Dr
- 10728 Lejean Dr
- 912 Choctaw Ridge Rd
- 10702 Lejean Dr