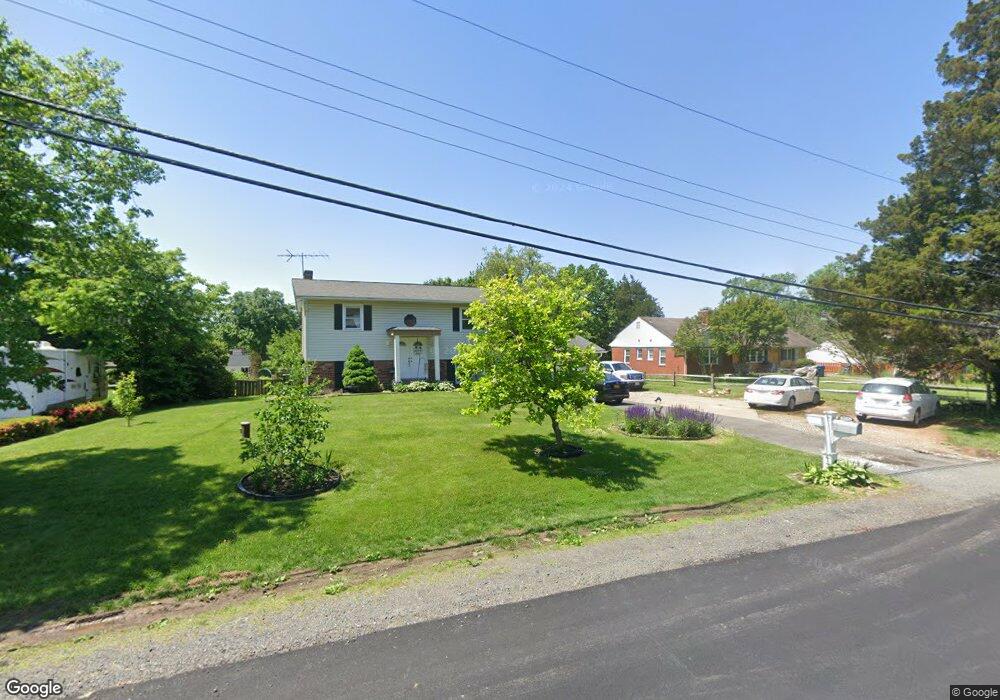
10721 Marlborough Rd Fairfax, VA 22032
Estimated Value: $753,000 - $801,000
5
Beds
3
Baths
880
Sq Ft
$891/Sq Ft
Est. Value
About This Home
This home is located at 10721 Marlborough Rd, Fairfax, VA 22032 and is currently estimated at $784,109, approximately $891 per square foot. 10721 Marlborough Rd is a home located in Fairfax County with nearby schools including Oak View Elementary School, James W Robinson, Jr. Secondary School, and Trinity Christian School.
Ownership History
Date
Name
Owned For
Owner Type
Purchase Details
Closed on
Sep 22, 2008
Sold by
Gmac Mortgage Llc
Bought by
Gutierrez Senovia
Current Estimated Value
Home Financials for this Owner
Home Financials are based on the most recent Mortgage that was taken out on this home.
Original Mortgage
$355,529
Outstanding Balance
$236,703
Interest Rate
6.54%
Mortgage Type
FHA
Estimated Equity
$547,406
Purchase Details
Closed on
Feb 24, 2006
Sold by
Park Jewn G
Bought by
Ann Jum S and Lee,Doosik
Home Financials for this Owner
Home Financials are based on the most recent Mortgage that was taken out on this home.
Original Mortgage
$444,000
Interest Rate
6.17%
Mortgage Type
New Conventional
Purchase Details
Closed on
May 21, 2003
Sold by
Hall Michael H
Bought by
Park Jewn G
Home Financials for this Owner
Home Financials are based on the most recent Mortgage that was taken out on this home.
Original Mortgage
$317,000
Interest Rate
5.86%
Mortgage Type
New Conventional
Create a Home Valuation Report for This Property
The Home Valuation Report is an in-depth analysis detailing your home's value as well as a comparison with similar homes in the area
Home Values in the Area
Average Home Value in this Area
Purchase History
| Date | Buyer | Sale Price | Title Company |
|---|---|---|---|
| Gutierrez Senovia | $362,000 | -- | |
| Ann Jum S | $555,000 | -- | |
| Park Jewn G | $352,000 | -- |
Source: Public Records
Mortgage History
| Date | Status | Borrower | Loan Amount |
|---|---|---|---|
| Open | Gutierrez Senovia | $355,529 | |
| Previous Owner | Ann Jum S | $444,000 | |
| Previous Owner | Park Jewn G | $317,000 |
Source: Public Records
Tax History Compared to Growth
Tax History
| Year | Tax Paid | Tax Assessment Tax Assessment Total Assessment is a certain percentage of the fair market value that is determined by local assessors to be the total taxable value of land and additions on the property. | Land | Improvement |
|---|---|---|---|---|
| 2025 | $7,527 | $721,390 | $301,000 | $420,390 |
| 2024 | $7,527 | $649,710 | $281,000 | $368,710 |
| 2023 | $7,094 | $628,660 | $281,000 | $347,660 |
| 2022 | $6,801 | $594,770 | $261,000 | $333,770 |
| 2021 | $6,098 | $519,620 | $236,000 | $283,620 |
| 2020 | $6,004 | $507,320 | $235,000 | $272,320 |
| 2019 | $6,004 | $507,320 | $235,000 | $272,320 |
| 2018 | $5,560 | $483,490 | $216,000 | $267,490 |
| 2017 | $5,682 | $489,420 | $216,000 | $273,420 |
| 2016 | $5,575 | $481,220 | $212,000 | $269,220 |
| 2015 | $5,216 | $467,380 | $206,000 | $261,380 |
| 2014 | $5,037 | $452,330 | $201,000 | $251,330 |
Source: Public Records
Map
Nearby Homes
- 10710 Almond St
- 0 Joshua Davis Ct
- 10708 Rippon Lodge Dr
- 10919 Spurlock Ct
- 10271 Braddock Rd
- 10255 Braddock Rd
- 11123 Popes Head Rd
- 10212 Provincetown Ct
- 10402 Hollyoak Place
- 5538 Shooters Hill Ln
- 4768 Farndon Ct
- 5503 Fireside Ct
- 4607 Tapestry Dr
- 4773 Farndon Ct
- 4316 Chain Bridge Rd
- 5308 Hexagon Place
- 11317 Edenderry Dr
- 10196 Red Spruce Rd
- 10412 Pearl St
- 10388 Hampshire Green Ave
- 10717 Marlborough Rd
- 10725 Marlborough Rd
- 10714 Ames St
- 10713 Marlborough Rd
- 10729 Marlborough Rd
- 10712 Ames St
- 10716 Ames St
- 10724 Marlborough Rd
- 10710 Ames St
- 10718 Ames St
- 10712 Marlborough Rd
- 10709 Buckingham Rd
- 10709 Marlborough Rd
- 10733 Marlborough Rd
- 10730 Marlborough Rd
- 10708 Ames St
- 10720 Ames St
- 4930 Princess Anne Ct
- 10713 Ames St
- 10707 Buckingham Rd