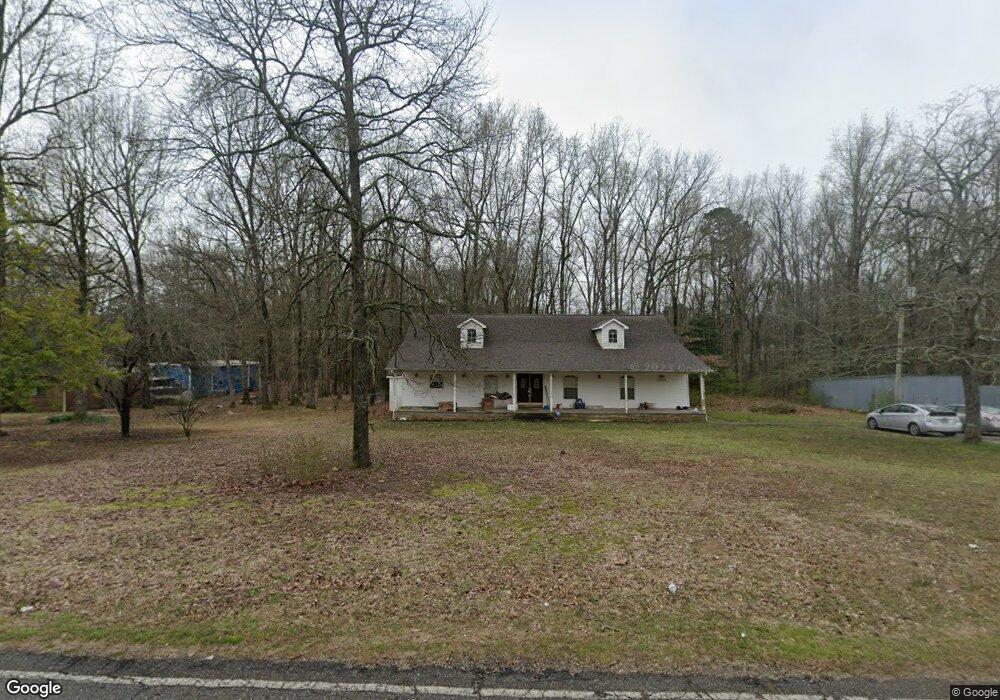
10725 Styles Rd Mabelvale, AR 72103
Estimated Value: $259,819 - $344,000
Studio
2
Baths
2,275
Sq Ft
$127/Sq Ft
Est. Value
About This Home
This home is located at 10725 Styles Rd, Mabelvale, AR 72103 and is currently estimated at $288,205, approximately $126 per square foot. 10725 Styles Rd is a home located in Saline County with nearby schools including Robert L. Davis Elementary School.
Ownership History
Date
Name
Owned For
Owner Type
Purchase Details
Closed on
Mar 30, 2005
Sold by
Pierce Glenn E and Pierce Tracy J
Bought by
Mcnabb Steven L and Mcnabb Angela F
Current Estimated Value
Home Financials for this Owner
Home Financials are based on the most recent Mortgage that was taken out on this home.
Original Mortgage
$132,450
Outstanding Balance
$68,302
Interest Rate
5.87%
Mortgage Type
Adjustable Rate Mortgage/ARM
Estimated Equity
$219,903
Purchase Details
Closed on
Feb 4, 2004
Bought by
Pierce
Purchase Details
Closed on
May 22, 2003
Bought by
Ingle
Purchase Details
Closed on
Apr 1, 2003
Bought by
Ingle
Purchase Details
Closed on
Dec 20, 2002
Bought by
Wells Fargo
Purchase Details
Closed on
Mar 21, 1997
Bought by
Brooks
Purchase Details
Closed on
Sep 1, 1991
Bought by
Jowers
Create a Home Valuation Report for This Property
The Home Valuation Report is an in-depth analysis detailing your home's value as well as a comparison with similar homes in the area
Purchase History
| Date | Buyer | Sale Price | Title Company |
|---|---|---|---|
| Mcnabb Steven L | $166,000 | -- | |
| Pierce | $165,000 | -- | |
| Ingle | $152,000 | -- | |
| Ingle | $152,000 | -- | |
| Wells Fargo | $128,000 | -- | |
| Brooks | $14,000 | -- | |
| Jowers | $10,000 | -- |
Source: Public Records
Mortgage History
| Date | Status | Borrower | Loan Amount |
|---|---|---|---|
| Open | Mcnabb Steven L | $132,450 |
Source: Public Records
Tax History
| Year | Tax Paid | Tax Assessment Tax Assessment Total Assessment is a certain percentage of the fair market value that is determined by local assessors to be the total taxable value of land and additions on the property. | Land | Improvement |
|---|---|---|---|---|
| 2025 | $2,136 | $51,297 | $3,840 | $47,457 |
| 2024 | $1,991 | $51,297 | $3,840 | $47,457 |
| 2023 | $1,693 | $51,297 | $3,840 | $47,457 |
| 2022 | $1,650 | $51,297 | $3,840 | $47,457 |
| 2021 | $1,564 | $36,910 | $3,200 | $33,710 |
| 2020 | $1,564 | $36,910 | $3,200 | $33,710 |
| 2019 | $1,564 | $36,910 | $3,200 | $33,710 |
| 2018 | $1,538 | $36,910 | $3,200 | $33,710 |
| 2017 | $1,456 | $36,910 | $3,200 | $33,710 |
| 2016 | $1,531 | $32,650 | $3,200 | $29,450 |
| 2015 | $1,531 | $32,650 | $3,200 | $29,450 |
| 2014 | $1,216 | $32,650 | $3,200 | $29,450 |
Source: Public Records
Map
Nearby Homes
- 10519 Jewell Dr
- 12407 Styles
- 20862 Mcpherson Rd
- 22683 Haskins Rd
- 8608 Hicks Rd
- 24401 Amanda Dr
- 8618 Hicks Rd
- 12786 W Sardis Rd
- 8831 Chicot Heights Rd
- TBD Hobby Trail
- 7009 Potomac Trail
- 7049 Potomac Trail
- 8080 Chesapeake Trail
- N Sardis
- 7057 Potomac Trail
- 8096 Chesapeake Trail
- TBD N Sardis Rd
- 7017 Potomac Trail
- 8088 Chesapeake Trail
- 8072 Chesapeake Trail
- 10715 Styles Rd
- 10629 Styles Rd
- 000 Styles Rd
- 10610 Styles Rd
- 12923 Styles Rd
- 10428 Styles Rd
- 22100 W Point Dr
- W Point Dr
- 22711 Gravel Ridge Rd
- 22514 Gravel Ridge Rd
- 0 E Sardis Rd Unit 24469005
- 0 E Sardis Rd Unit 24234416
- 0 E Sardis Rd Unit 23949656
- 0 E Sardis Rd Unit 23626758
- 0 E Sardis Rd Unit 23037849
- 22318 Louise Ln
- 0 Gravel Ridge Rd
- 22431 N Sardis Rd
- 22718 Gravel Ridge Rd
- 22511 N Sardis Rd
Your Personal Tour Guide
Ask me questions while you tour the home.