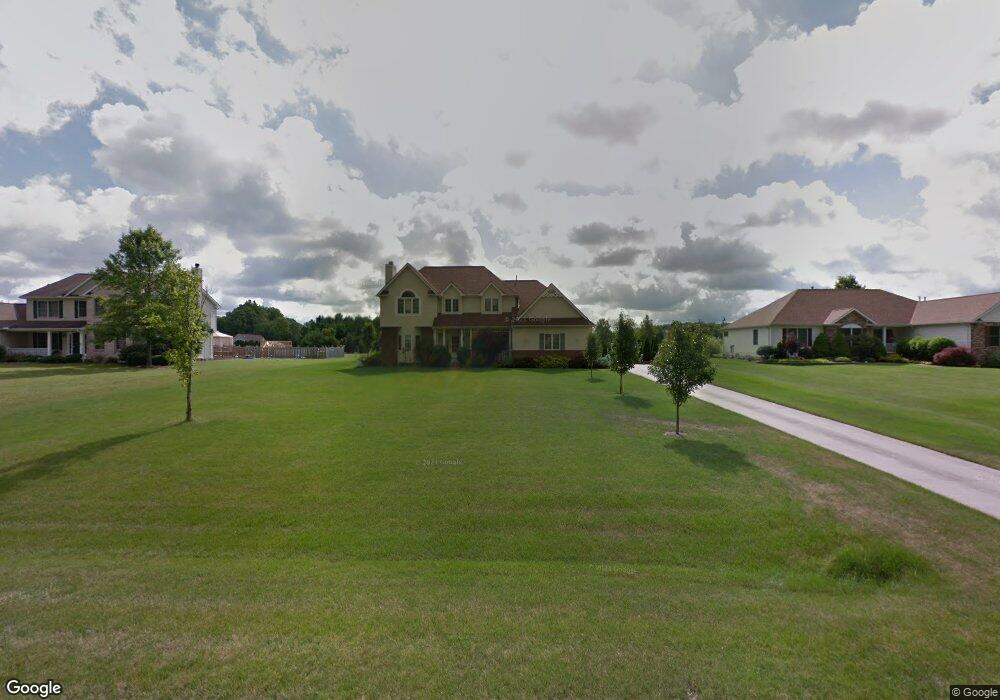
10729 Bridle Path Columbia Station, OH 44028
Estimated Value: $461,000 - $539,000
4
Beds
3
Baths
2,702
Sq Ft
$184/Sq Ft
Est. Value
About This Home
This home is located at 10729 Bridle Path, Columbia Station, OH 44028 and is currently estimated at $497,608, approximately $184 per square foot. 10729 Bridle Path is a home located in Lorain County with nearby schools including Copopa Elementary School, Columbia Middle School, and Columbia High School.
Ownership History
Date
Name
Owned For
Owner Type
Purchase Details
Closed on
Sep 28, 1998
Sold by
Burianek Building Co Inc
Bought by
Nebinger Michael A and Nebinger Susan M
Current Estimated Value
Home Financials for this Owner
Home Financials are based on the most recent Mortgage that was taken out on this home.
Original Mortgage
$120,000
Outstanding Balance
$26,477
Interest Rate
6.99%
Estimated Equity
$471,131
Purchase Details
Closed on
May 4, 1998
Sold by
Bradley Development Co Inc
Bought by
Burianek Building Co Inc
Home Financials for this Owner
Home Financials are based on the most recent Mortgage that was taken out on this home.
Original Mortgage
$179,900
Interest Rate
7.2%
Create a Home Valuation Report for This Property
The Home Valuation Report is an in-depth analysis detailing your home's value as well as a comparison with similar homes in the area
Home Values in the Area
Average Home Value in this Area
Purchase History
| Date | Buyer | Sale Price | Title Company |
|---|---|---|---|
| Nebinger Michael A | $224,900 | Midland Title | |
| Burianek Building Co Inc | $50,000 | Midland Title |
Source: Public Records
Mortgage History
| Date | Status | Borrower | Loan Amount |
|---|---|---|---|
| Open | Nebinger Michael A | $120,000 | |
| Previous Owner | Burianek Building Co Inc | $179,900 |
Source: Public Records
Tax History Compared to Growth
Tax History
| Year | Tax Paid | Tax Assessment Tax Assessment Total Assessment is a certain percentage of the fair market value that is determined by local assessors to be the total taxable value of land and additions on the property. | Land | Improvement |
|---|---|---|---|---|
| 2024 | $5,940 | $136,273 | $29,750 | $106,523 |
| 2023 | $5,297 | $106,054 | $22,953 | $83,101 |
| 2022 | $5,166 | $106,054 | $22,953 | $83,101 |
| 2021 | $5,217 | $106,054 | $22,953 | $83,101 |
| 2020 | $5,316 | $97,030 | $21,000 | $76,030 |
| 2019 | $5,284 | $97,030 | $21,000 | $76,030 |
| 2018 | $5,358 | $97,030 | $21,000 | $76,030 |
| 2017 | $5,393 | $91,410 | $20,810 | $70,600 |
| 2016 | $5,432 | $91,410 | $20,810 | $70,600 |
| 2015 | $5,472 | $91,410 | $20,810 | $70,600 |
| 2014 | $4,546 | $86,720 | $19,740 | $66,980 |
| 2013 | $4,546 | $86,720 | $19,740 | $66,980 |
Source: Public Records
Map
Nearby Homes
- 24032 Edward Ln
- 10702 Winding Creek Chase
- 8960 Leatherleaf Dr
- 1046 Ashford Ct
- Columbia Plan at Ashford Cove
- Anderson Plan at Ashford Cove
- Hudson Plan at Ashford Cove
- Ballenger Plan at Ashford Cove
- Lehigh Plan at Ashford Cove
- 8981 Leatherleaf Dr
- 12584 Caribou Ct
- 12857 Caribou Ct
- 23789 Snell Rd
- 8809 Leatherleaf Dr
- V/L Aldridge Dr
- 8896 Firethorne Dr
- 0 E River Rd Unit 5120285
- 24628 Sprague Rd
- 23409 Kim's Trail
- 12150 N Boone Rd
- 10701 Bridle Path
- 10741 Bridle Path
- 10687 Bridle Path
- 25116 Trotter Ct
- 10698 Bridle Path
- 25110 Crosstie Trail
- 10789 Bridle Path
- 10625 Bridle Path
- 10704 Bridle Path
- 10736 Bridle Path
- 25106 Crosstie Trail
- 25114 Crosstie Trail
- 10748 Bridle Path
- 10662 Bridle Path
- 25120 Trotter Ct
- 10610 Bridle Path
- 10772 Bridle Path
- 10605 Bridle Path
- 23785 Redfern Rd
- 25122 Crosstie Trail