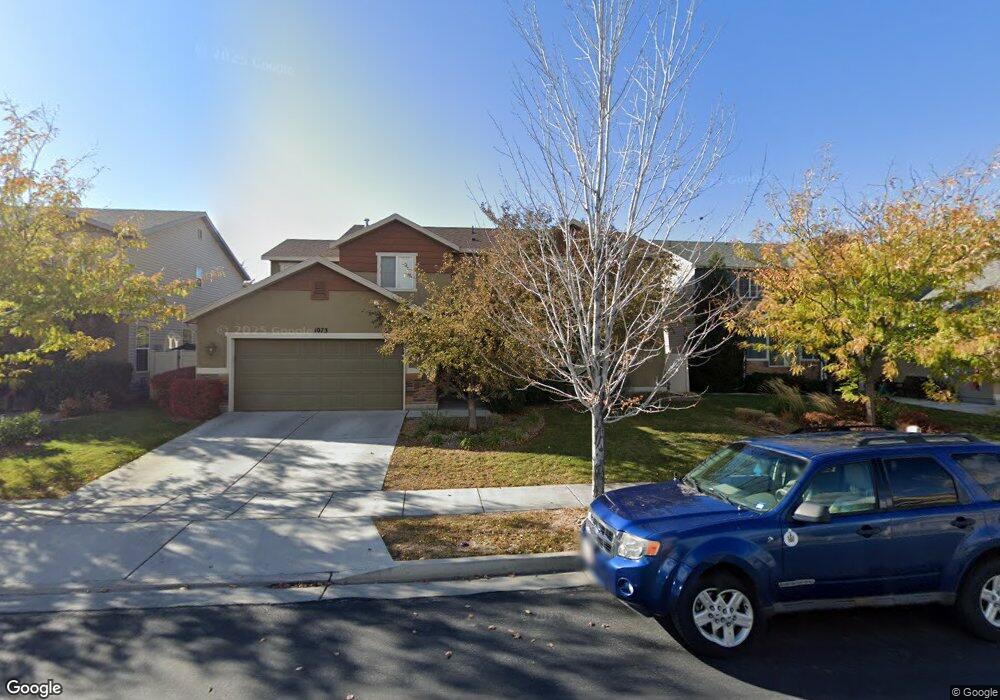
1073 Danby Dr Unit 916 North Salt Lake, UT 84054
Estimated Value: $625,000 - $689,000
4
Beds
4
Baths
2,599
Sq Ft
$249/Sq Ft
Est. Value
About This Home
This home is located at 1073 Danby Dr Unit 916, North Salt Lake, UT 84054 and is currently estimated at $646,204, approximately $248 per square foot. 1073 Danby Dr Unit 916 is a home located in Davis County with nearby schools including Foxboro School, Mueller Park Junior High School, and Bountiful High School.
Ownership History
Date
Name
Owned For
Owner Type
Purchase Details
Closed on
Dec 1, 2014
Sold by
Foxboro Estates Llc
Bought by
Kukta Andrew J and Kukta Heidi M
Current Estimated Value
Create a Home Valuation Report for This Property
The Home Valuation Report is an in-depth analysis detailing your home's value as well as a comparison with similar homes in the area
Home Values in the Area
Average Home Value in this Area
Purchase History
| Date | Buyer | Sale Price | Title Company |
|---|---|---|---|
| Kukta Andrew J | -- | Us Title Company Of U |
Source: Public Records
Tax History Compared to Growth
Tax History
| Year | Tax Paid | Tax Assessment Tax Assessment Total Assessment is a certain percentage of the fair market value that is determined by local assessors to be the total taxable value of land and additions on the property. | Land | Improvement |
|---|---|---|---|---|
| 2025 | $3,095 | $319,550 | $104,295 | $215,255 |
| 2024 | $3,095 | $311,300 | $109,760 | $201,540 |
| 2023 | $2,920 | $531,000 | $144,173 | $386,827 |
| 2022 | $3,047 | $304,150 | $62,734 | $241,416 |
| 2021 | $2,852 | $432,000 | $91,500 | $340,500 |
| 2020 | $2,536 | $380,000 | $77,944 | $302,056 |
| 2019 | $2,559 | $374,000 | $61,966 | $312,034 |
| 2018 | $2,345 | $339,000 | $56,333 | $282,667 |
| 2016 | $2,186 | $168,025 | $30,983 | $137,042 |
| 2015 | $2,085 | $154,000 | $30,983 | $123,017 |
| 2014 | $2,103 | $158,342 | $30,983 | $127,359 |
| 2013 | -- | $127,735 | $28,511 | $99,224 |
Source: Public Records
Map
Nearby Homes
- 1052 Chidester Dr
- 1150 Wiltshire Dr
- 997 Amberly Dr
- 997 N Fox Hollow Dr
- 967 Amberly Dr
- 1022 Allington Dr
- 1049 Allington Dr
- 1147 Abbotsford Dr
- 1074 Allington Dr
- 928 Amberly Dr
- 942 N Abbey Dr
- Somerset B Plan at Clifton Place Townhomes
- Somerset A Plan at Clifton Place Townhomes
- Camden Plan at Clifton Place Townhomes
- Charleston Plan at Clifton Place Townhomes
- Kensington Plan at Clifton Place Townhomes
- 1002 W Stonehaven Dr Unit 108
- 940 W Stonehaven Dr
- 1152 N Clifton Dr Unit 116
- 920 W Stonehaven Dr
- 1081 Danby Dr
- 1065 Danby Dr Unit 915
- 1088 N Fox Hollow Dr
- 1074 N Fox Hollow Dr
- 1099 Danby Dr
- 1055 Danby Dr
- 1062 N Fox Hollow Dr
- 1062 N Fox Hollow Dr
- 1094 N Fox Hollow Dr
- 1072 Danby Dr
- 1080 Danby Dr Unit 901
- 1080 Danby Dr
- 1062 Danby Dr
- 1058 N Fox Hollow Dr
- 1047 Danby Dr
- 1096 Danby Dr
- 1052 Danby Dr
- 1046 N Fox Hollow Dr
- 1075 Newham Ct
- 1069 Newham Ct