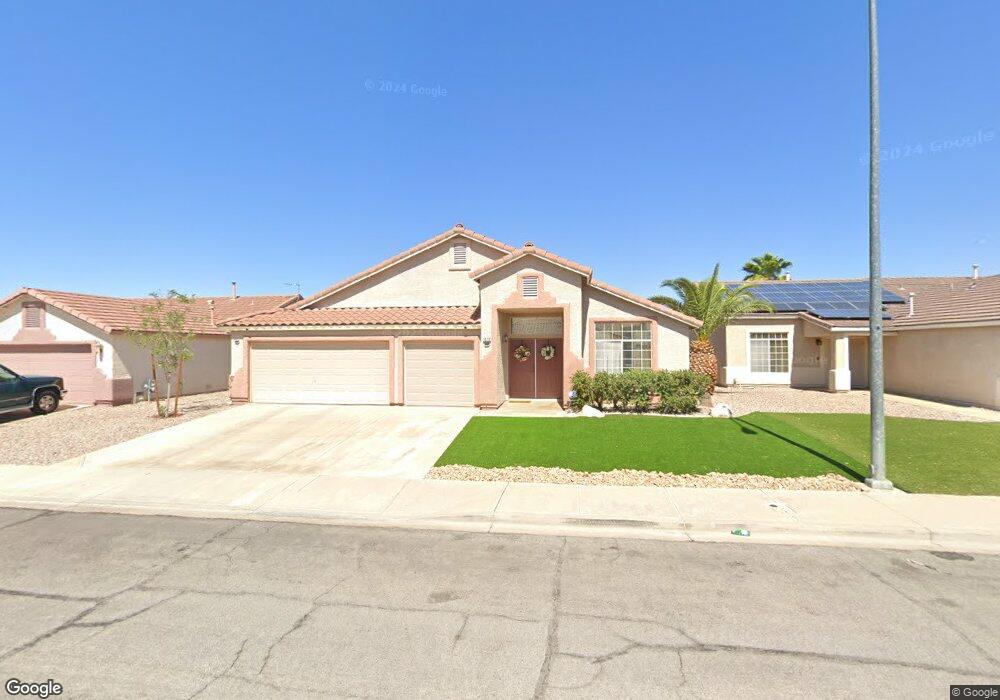
1073 Kennebunk Cir Henderson, NV 89015
River Mountain NeighborhoodEstimated Value: $497,000 - $519,438
4
Beds
2
Baths
2,096
Sq Ft
$244/Sq Ft
Est. Value
About This Home
This home is located at 1073 Kennebunk Cir, Henderson, NV 89015 and is currently estimated at $511,860, approximately $244 per square foot. 1073 Kennebunk Cir is a home located in Clark County with nearby schools including Sue H. Morrow Elementary School, B Mahlon Brown Academy of International Studies, and Basic Academy of International Studies.
Ownership History
Date
Name
Owned For
Owner Type
Purchase Details
Closed on
Jul 15, 2020
Sold by
Chalfant Mary L
Bought by
Chalfant Mary Lou and Mary Lou Chalfant Revocable Li
Current Estimated Value
Purchase Details
Closed on
Mar 12, 2010
Sold by
Chalfant James
Bought by
Chalfant Mary L
Home Financials for this Owner
Home Financials are based on the most recent Mortgage that was taken out on this home.
Original Mortgage
$145,856
Outstanding Balance
$96,767
Interest Rate
5%
Mortgage Type
New Conventional
Estimated Equity
$415,093
Purchase Details
Closed on
Dec 20, 2001
Sold by
Chalfant Mary L and Chalfant James
Bought by
Chalfant Ii James and Chalfant Mary L
Home Financials for this Owner
Home Financials are based on the most recent Mortgage that was taken out on this home.
Original Mortgage
$154,000
Interest Rate
6.51%
Purchase Details
Closed on
Dec 10, 1997
Sold by
Greystone Homes Inc
Bought by
Chalfant Ii James and Chalfant Mary
Home Financials for this Owner
Home Financials are based on the most recent Mortgage that was taken out on this home.
Original Mortgage
$139,300
Interest Rate
7.23%
Create a Home Valuation Report for This Property
The Home Valuation Report is an in-depth analysis detailing your home's value as well as a comparison with similar homes in the area
Home Values in the Area
Average Home Value in this Area
Purchase History
| Date | Buyer | Sale Price | Title Company |
|---|---|---|---|
| Chalfant Mary Lou | -- | None Available | |
| Chalfant Mary L | -- | Ticor Title Las Vegas | |
| Chalfant Ii James | -- | Lawyers Title | |
| Chalfant Ii James | $155,000 | Nevada Title Company |
Source: Public Records
Mortgage History
| Date | Status | Borrower | Loan Amount |
|---|---|---|---|
| Open | Chalfant Mary L | $145,856 | |
| Closed | Chalfant Ii James | $154,000 | |
| Closed | Chalfant Ii James | $139,300 |
Source: Public Records
Tax History Compared to Growth
Tax History
| Year | Tax Paid | Tax Assessment Tax Assessment Total Assessment is a certain percentage of the fair market value that is determined by local assessors to be the total taxable value of land and additions on the property. | Land | Improvement |
|---|---|---|---|---|
| 2025 | $2,070 | $113,433 | $30,100 | $83,333 |
| 2024 | $2,010 | $113,433 | $30,100 | $83,333 |
| 2023 | $1,640 | $114,252 | $35,350 | $78,902 |
| 2022 | $1,952 | $102,972 | $30,450 | $72,522 |
| 2021 | $1,895 | $95,335 | $26,250 | $69,085 |
| 2020 | $1,837 | $93,173 | $24,500 | $68,673 |
| 2019 | $1,783 | $89,647 | $22,050 | $67,597 |
| 2018 | $1,732 | $82,748 | $17,500 | $65,248 |
| 2017 | $2,397 | $82,705 | $16,450 | $66,255 |
| 2016 | $1,640 | $76,122 | $9,800 | $66,322 |
| 2015 | $1,637 | $60,275 | $9,800 | $50,475 |
| 2014 | $1,589 | $54,949 | $8,400 | $46,549 |
Source: Public Records
Map
Nearby Homes
- 1041 Kennebunk Cir
- 1044 Kennebunk Cir
- 620 Camp Hill Rd
- 1038 Beaver Crest Terrace
- 1024 Greyhound Ln
- 1077 Nordyke Ave
- 1001 Benton Ave
- 717 Triple Crown St
- 1008 Beaver Crest Terrace
- 623 Braverwood Dr
- 698 S Racetrack Rd Unit 1411
- 698 S Racetrack Rd Unit 724
- 698 S Racetrack Rd Unit 1521
- 698 S Racetrack Rd Unit 1621
- 719 Tawney Eagle St
- 730 Booted Eagle St
- 732 Goshawk St
- 731 Tawney Eagle St
- 1082 Langston Ranch Ave
- 1126 Langston Ranch Ave
- 1075 Kennebunk Cir
- 1071 Kennebunk Cir
- 1037 Kennebunk Cir
- 1035 Kennebunk Cir
- 1077 Kennebunk Cir
- 1069 Kennebunk Cir
- 1039 Kennebunk Cir
- 1033 Kennebunk Cir
- 1072 Kennebunk Cir
- 1074 Kennebunk Cir
- 1074 Kennebunk Cir
- 1074 Kennebunk Cir
- 1070 Kennebunk Cir
- 1067 Kennebunk Cir
- 1079 Kennebunk Cir
- 1076 Kennebunk Cir
- 1031 Kennebunk Cir
- 1066 Kennebunk Cir
- 1078 Kennebunk Cir
- 1036 Juniper Ridge Ave