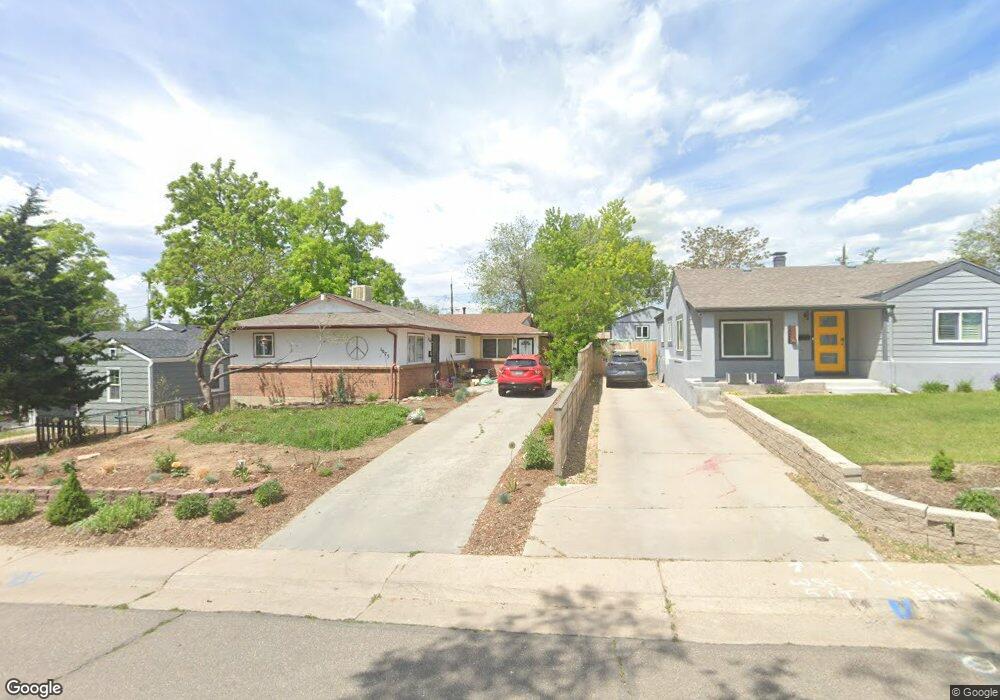
1073 S Osceola St Denver, CO 80219
Westwood NeighborhoodEstimated Value: $332,000 - $406,000
5
Beds
2
Baths
1,728
Sq Ft
$215/Sq Ft
Est. Value
About This Home
This home is located at 1073 S Osceola St, Denver, CO 80219 and is currently estimated at $371,883, approximately $215 per square foot. 1073 S Osceola St is a home located in Denver County with nearby schools including Castro Elementary School, Kepner Beacon Middle School, and West High School.
Ownership History
Date
Name
Owned For
Owner Type
Purchase Details
Closed on
Aug 17, 2018
Sold by
Lightfoot Laureance B
Bought by
Wu Zehao
Current Estimated Value
Purchase Details
Closed on
Feb 9, 2007
Sold by
Hud
Bought by
Lightfoot Laurance B
Purchase Details
Closed on
May 17, 2006
Sold by
National City Mortgage Inc
Bought by
Hud
Purchase Details
Closed on
May 2, 2006
Sold by
Rodriguez Miriam
Bought by
National City Mortgage Inc
Purchase Details
Closed on
May 17, 2004
Sold by
Briones Ruth and Briones Gilmar
Bought by
Rodriguez Miriam
Home Financials for this Owner
Home Financials are based on the most recent Mortgage that was taken out on this home.
Original Mortgage
$182,141
Interest Rate
5.81%
Mortgage Type
FHA
Purchase Details
Closed on
Sep 26, 2002
Sold by
Applebaum Alan
Bought by
Briones Ruth and Briones Gilmar
Home Financials for this Owner
Home Financials are based on the most recent Mortgage that was taken out on this home.
Original Mortgage
$165,000
Interest Rate
10.25%
Create a Home Valuation Report for This Property
The Home Valuation Report is an in-depth analysis detailing your home's value as well as a comparison with similar homes in the area
Home Values in the Area
Average Home Value in this Area
Purchase History
| Date | Buyer | Sale Price | Title Company |
|---|---|---|---|
| Wu Zehao | $220,000 | First American Title | |
| Lightfoot Laurance B | -- | None Available | |
| Hud | -- | None Available | |
| National City Mortgage Inc | -- | Quantum Title Llc | |
| Rodriguez Miriam | $185,000 | -- | |
| Briones Ruth | $165,000 | Land Title |
Source: Public Records
Mortgage History
| Date | Status | Borrower | Loan Amount |
|---|---|---|---|
| Previous Owner | Rodriguez Miriam | $182,141 | |
| Previous Owner | Briones Ruth | $165,000 |
Source: Public Records
Tax History Compared to Growth
Tax History
| Year | Tax Paid | Tax Assessment Tax Assessment Total Assessment is a certain percentage of the fair market value that is determined by local assessors to be the total taxable value of land and additions on the property. | Land | Improvement |
|---|---|---|---|---|
| 2024 | $1,663 | $21,000 | $3,630 | $17,370 |
| 2023 | $1,627 | $21,000 | $3,630 | $17,370 |
| 2022 | $1,742 | $21,900 | $3,480 | $18,420 |
| 2021 | $1,681 | $22,530 | $3,580 | $18,950 |
| 2020 | $1,471 | $19,820 | $2,710 | $17,110 |
| 2019 | $1,429 | $19,820 | $2,710 | $17,110 |
| 2018 | $974 | $12,590 | $1,950 | $10,640 |
| 2017 | $971 | $12,590 | $1,950 | $10,640 |
| 2016 | $950 | $11,650 | $1,831 | $9,819 |
| 2015 | $910 | $11,650 | $1,831 | $9,819 |
| 2014 | $607 | $7,310 | $1,083 | $6,227 |
Source: Public Records
Map
Nearby Homes
- 1057 S Osceola St
- 1124 S Perry St
- 1050 S Quitman St
- 1110 S Quitman St
- 1200 S Patton Ct
- 960 S Perry St
- 3918 W Kentucky Ave
- 1255 S Patton Ct
- 990 S Meade St
- 4445 W Tennessee Ave
- 3441 W Ford Place
- 3947 W Ohio Ave Unit 17
- 1361 S Perry St
- 3503 W Ada Place
- 855 S Knox Ct
- 1381 S Perry St
- 364 S Newton St
- 1065 S Irving St Unit west half of lot 24
- 1135 S Vrain St
- 3703 W Walsh Place
- 1075 S Osceola St
- 1069 S Osceola St
- 1088 S Patton Ct
- 1065 S Osceola St
- 1072 S Patton Ct
- 1080 S Patton Ct
- 1062 S Patton Ct
- 3970 W Mississippi Ave
- 1092 S Osceola St
- 1064 S Patton Ct
- 1064 S Patton Ct
- 1068 S Osceola St
- 3960 W Mississippi Ave
- 1049 S Osceola St
- 3980 W Mississippi Ave
- 1060 S Osceola St
- 1048 S Patton Ct
- 1048 S Patton Ct Unit B
- 1048 S Patton Ct Unit A
- 1058 S Osceola St