Estimated Value: $189,000 - $215,000
3
Beds
2
Baths
1,320
Sq Ft
$152/Sq Ft
Est. Value
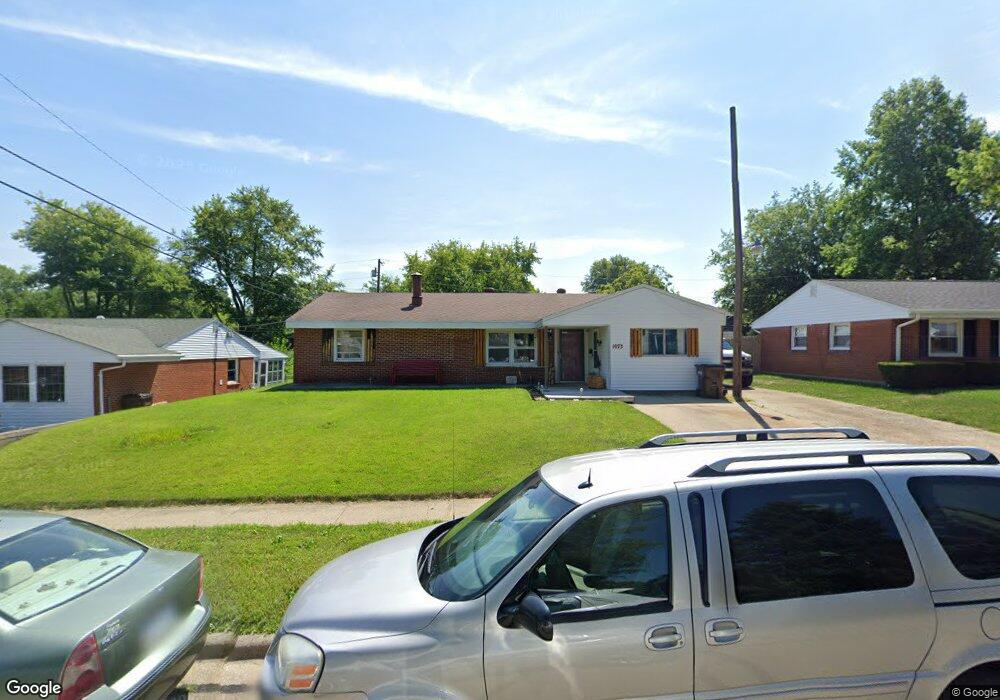
About This Home
This home is located at 1073 Salem Ln, Xenia, OH 45385 and is currently estimated at $201,226, approximately $152 per square foot. 1073 Salem Ln is a home located in Greene County with nearby schools including Xenia High School, Summit Academy Community School for Alternative Learners - Xenia, and Legacy Christian Academy.
Ownership History
Date
Name
Owned For
Owner Type
Purchase Details
Closed on
Jun 30, 2005
Sold by
Hres Investments Llc
Bought by
Ryan Roger A
Current Estimated Value
Home Financials for this Owner
Home Financials are based on the most recent Mortgage that was taken out on this home.
Original Mortgage
$81,600
Outstanding Balance
$42,844
Interest Rate
5.75%
Mortgage Type
Fannie Mae Freddie Mac
Estimated Equity
$158,382
Purchase Details
Closed on
Jan 13, 2005
Sold by
Hud
Bought by
Hres Investments Llc
Purchase Details
Closed on
Aug 27, 2004
Sold by
Neal William R and Neal Malissa E
Bought by
Hud
Purchase Details
Closed on
May 16, 2001
Sold by
Neal Ramey R and Neal Edith
Bought by
Neal William R and Neal Ramey R
Home Financials for this Owner
Home Financials are based on the most recent Mortgage that was taken out on this home.
Original Mortgage
$78,119
Interest Rate
7.16%
Mortgage Type
FHA
Create a Home Valuation Report for This Property
The Home Valuation Report is an in-depth analysis detailing your home's value as well as a comparison with similar homes in the area
Home Values in the Area
Average Home Value in this Area
Purchase History
| Date | Buyer | Sale Price | Title Company |
|---|---|---|---|
| Ryan Roger A | $102,000 | -- | |
| Hres Investments Llc | $65,810 | -- | |
| Hud | $75,000 | -- | |
| Neal William R | -- | -- |
Source: Public Records
Mortgage History
| Date | Status | Borrower | Loan Amount |
|---|---|---|---|
| Open | Ryan Roger A | $81,600 | |
| Previous Owner | Neal William R | $78,119 |
Source: Public Records
Tax History Compared to Growth
Tax History
| Year | Tax Paid | Tax Assessment Tax Assessment Total Assessment is a certain percentage of the fair market value that is determined by local assessors to be the total taxable value of land and additions on the property. | Land | Improvement |
|---|---|---|---|---|
| 2024 | $2,423 | $56,620 | $9,510 | $47,110 |
| 2023 | $2,423 | $56,620 | $9,510 | $47,110 |
| 2022 | $2,105 | $41,960 | $6,800 | $35,160 |
| 2021 | $2,133 | $41,960 | $6,800 | $35,160 |
| 2020 | $2,044 | $41,960 | $6,800 | $35,160 |
| 2019 | $1,706 | $32,970 | $4,240 | $28,730 |
| 2018 | $1,713 | $32,970 | $4,240 | $28,730 |
| 2017 | $1,559 | $32,970 | $4,240 | $28,730 |
| 2016 | $1,559 | $29,450 | $4,240 | $25,210 |
| 2015 | $1,563 | $29,450 | $4,240 | $25,210 |
| 2014 | $1,534 | $29,450 | $4,240 | $25,210 |
Source: Public Records
Map
Nearby Homes
- 523 Newport Rd
- 55 Lake St
- 733 State Route 380
- 46 Lake St
- 847 S Detroit St
- 633 Xenia Ave
- 453 Walnut St
- 293 S Miami Ave
- 260 Pocahontas St
- 305-325 Bellbrook Ave
- 979 Mcdowell St
- 1208 Bellbrook Ave
- 1272 Bellbrook Ave
- 148 Home Ave
- 400 S Detroit St
- 222 Washington St
- 98 W 3rd St
- 36 Leaman St
- 75 W 2nd St
- 1144 Rockwell Dr