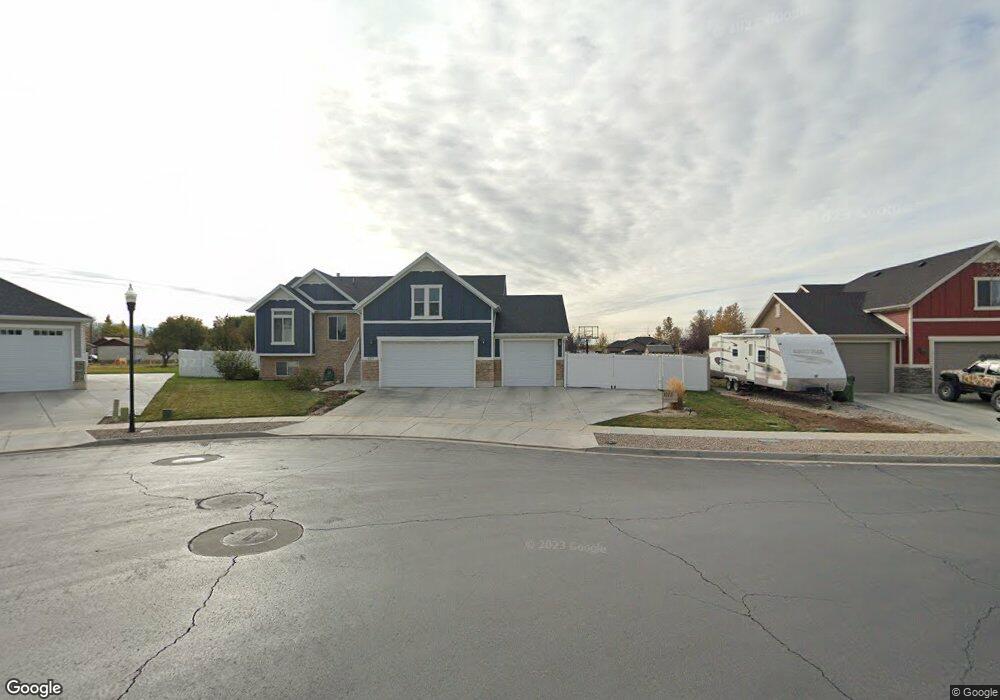
1073 W 2150 S Syracuse, UT 84075
Estimated Value: $555,000 - $685,287
3
Beds
2
Baths
1,854
Sq Ft
$348/Sq Ft
Est. Value
About This Home
This home is located at 1073 W 2150 S, Syracuse, UT 84075 and is currently estimated at $645,572, approximately $348 per square foot. 1073 W 2150 S is a home with nearby schools including Bluff Ridge Elementary, Legacy Junior High School, and Clearfield High School.
Ownership History
Date
Name
Owned For
Owner Type
Purchase Details
Closed on
Oct 22, 2020
Sold by
Draper Shane S
Bought by
Draper Shane S and Draper Jessica A
Current Estimated Value
Home Financials for this Owner
Home Financials are based on the most recent Mortgage that was taken out on this home.
Original Mortgage
$270,000
Outstanding Balance
$230,676
Interest Rate
2.8%
Mortgage Type
New Conventional
Estimated Equity
$414,896
Purchase Details
Closed on
Apr 11, 2016
Sold by
Cedar Ridge Homes Inc
Bought by
Draper Shane S and Draper Jessica A
Purchase Details
Closed on
Feb 17, 2016
Sold by
Rhoades Michael and Rhoades Charlotte
Bought by
Cedar Ridge Homes Inc
Purchase Details
Closed on
Feb 3, 2015
Sold by
Thr Investments Llc
Bought by
Rhoades Michael and Rhoades Charlotte
Create a Home Valuation Report for This Property
The Home Valuation Report is an in-depth analysis detailing your home's value as well as a comparison with similar homes in the area
Home Values in the Area
Average Home Value in this Area
Purchase History
| Date | Buyer | Sale Price | Title Company |
|---|---|---|---|
| Draper Shane S | -- | Inwest Title Services | |
| Draper Shane S | -- | Inwest Title Services | |
| Draper Shane S | -- | Mountain View Title & Escrow | |
| Cedar Ridge Homes Inc | -- | Stewart Title | |
| Rhoades Michael | -- | None Available |
Source: Public Records
Mortgage History
| Date | Status | Borrower | Loan Amount |
|---|---|---|---|
| Open | Draper Shane S | $270,000 |
Source: Public Records
Tax History Compared to Growth
Tax History
| Year | Tax Paid | Tax Assessment Tax Assessment Total Assessment is a certain percentage of the fair market value that is determined by local assessors to be the total taxable value of land and additions on the property. | Land | Improvement |
|---|---|---|---|---|
| 2025 | $3,546 | $342,100 | $126,311 | $215,789 |
| 2024 | $3,335 | $323,950 | $105,761 | $218,189 |
| 2023 | $3,147 | $557,000 | $147,290 | $409,710 |
| 2022 | $3,288 | $319,000 | $84,608 | $234,392 |
| 2021 | $2,916 | $438,000 | $125,179 | $312,821 |
| 2020 | $2,744 | $399,000 | $108,394 | $290,606 |
| 2019 | $2,654 | $381,000 | $106,746 | $274,254 |
| 2018 | $2,498 | $356,000 | $102,665 | $253,335 |
| 2016 | $791 | $59,095 | $35,087 | $24,008 |
Source: Public Records
Map
Nearby Homes