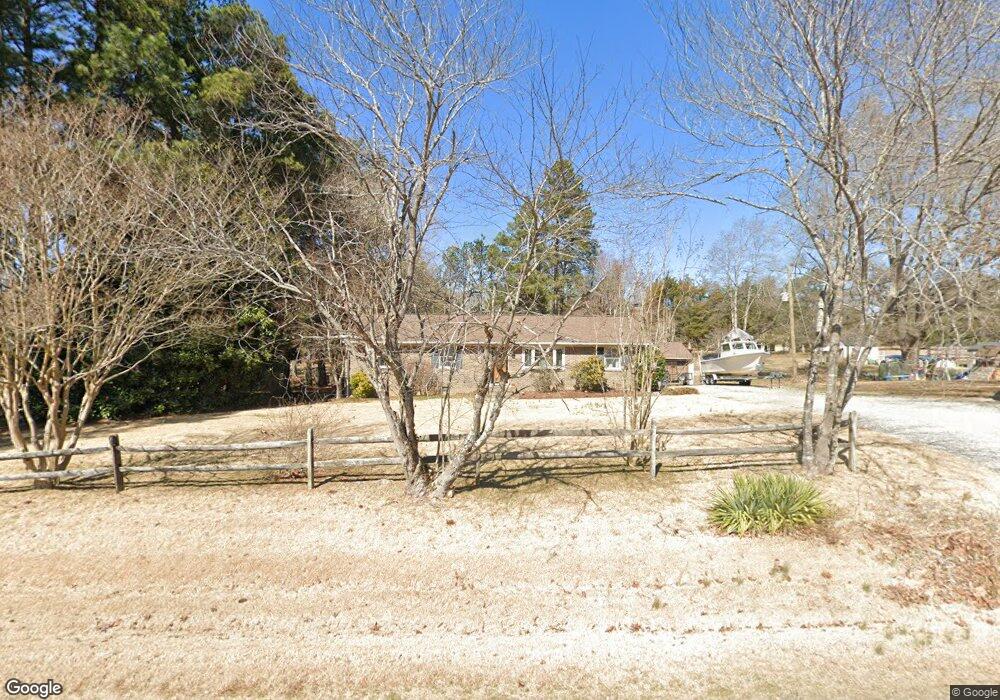
10730 Trents Bridge Rd Chesterfield, VA 23838
South Chesterfield County NeighborhoodEstimated Value: $335,000 - $367,124
3
Beds
3
Baths
1,825
Sq Ft
$194/Sq Ft
Est. Value
About This Home
This home is located at 10730 Trents Bridge Rd, Chesterfield, VA 23838 and is currently estimated at $354,781, approximately $194 per square foot. 10730 Trents Bridge Rd is a home located in Chesterfield County with nearby schools including Matoaca Elementary School, Matoaca Middle School, and Matoaca High School.
Ownership History
Date
Name
Owned For
Owner Type
Purchase Details
Closed on
Sep 29, 2009
Sold by
Citimortgage Inc
Bought by
Benson Douglas F
Current Estimated Value
Home Financials for this Owner
Home Financials are based on the most recent Mortgage that was taken out on this home.
Original Mortgage
$135,500
Outstanding Balance
$88,389
Interest Rate
5.06%
Mortgage Type
FHA
Estimated Equity
$266,392
Purchase Details
Closed on
Jun 22, 2006
Sold by
Simpson Anthony
Bought by
Ward Grover
Home Financials for this Owner
Home Financials are based on the most recent Mortgage that was taken out on this home.
Original Mortgage
$155,200
Interest Rate
6.71%
Mortgage Type
New Conventional
Purchase Details
Closed on
Jan 25, 2002
Bought by
Simpson Anthony W and Simpson Odene F
Home Financials for this Owner
Home Financials are based on the most recent Mortgage that was taken out on this home.
Original Mortgage
$12,147
Interest Rate
7.08%
Mortgage Type
New Conventional
Create a Home Valuation Report for This Property
The Home Valuation Report is an in-depth analysis detailing your home's value as well as a comparison with similar homes in the area
Home Values in the Area
Average Home Value in this Area
Purchase History
| Date | Buyer | Sale Price | Title Company |
|---|---|---|---|
| Benson Douglas F | $138,000 | -- | |
| Ward Grover | $194,000 | -- | |
| Simpson Anthony W | -- | -- |
Source: Public Records
Mortgage History
| Date | Status | Borrower | Loan Amount |
|---|---|---|---|
| Open | Benson Douglas F | $135,500 | |
| Previous Owner | Ward Grover | $155,200 | |
| Previous Owner | Simpson Anthony W | $12,147 |
Source: Public Records
Tax History Compared to Growth
Tax History
| Year | Tax Paid | Tax Assessment Tax Assessment Total Assessment is a certain percentage of the fair market value that is determined by local assessors to be the total taxable value of land and additions on the property. | Land | Improvement |
|---|---|---|---|---|
| 2025 | $2,448 | $272,200 | $62,000 | $210,200 |
| 2024 | $2,448 | $260,000 | $60,000 | $200,000 |
| 2023 | $2,188 | $240,400 | $56,000 | $184,400 |
| 2022 | $2,015 | $219,000 | $51,000 | $168,000 |
| 2021 | $1,979 | $201,400 | $49,000 | $152,400 |
| 2020 | $1,876 | $197,500 | $49,000 | $148,500 |
| 2019 | $1,809 | $190,400 | $47,000 | $143,400 |
| 2018 | $1,766 | $185,900 | $45,000 | $140,900 |
| 2017 | $1,722 | $179,400 | $43,000 | $136,400 |
| 2016 | $1,688 | $175,800 | $43,000 | $132,800 |
| 2015 | $1,704 | $174,900 | $43,000 | $131,900 |
| 2014 | $1,634 | $167,600 | $43,000 | $124,600 |
Source: Public Records
Map
Nearby Homes
- 10512 River Rd
- SALEM Plan at Peacefield
- HANOVER Plan at Peacefield
- Hayden Plan at Peacefield
- CALI Plan at Peacefield
- GALEN-Hip Plan at Peacefield
- 9818 Peacefield Ct
- 10200 Graves Rd
- 9819 Graves Rd
- 11312 Corte Castle Rd
- 17416 Chemin Rd
- 9618 Kathleen Dr
- 17530 Chemin Rd
- 17513 Kathleen Ct
- 15631 Corte Castle Terrace
- 15609 Rowlett Rd
- 15624 Corte Castle Terrace
- 9309 Graves Rd
- 15819 Chesdin Bluff Dr
- 9030 Anvil Forge Ln
- 10740 Trents Bridge Rd
- 10720 Trents Bridge Rd
- 10710 Trents Bridge Rd
- 10800 Trents Bridge Rd
- 10713 Trents Bridge Rd
- 10741 Trents Bridge Rd
- 10707 Trents Bridge Rd
- 10700 Trents Bridge Rd
- 10802 Trents Bridge Rd
- 10805 Trents Bridge Rd
- 10701 Trents Bridge Rd
- 10620 Trents Bridge Rd
- 10521 River Rd
- 10627 Trents Bridge Rd
- 10815 Trents Bridge Rd
- 10517 River Rd
- 10501 River Rd
- 10429 River Rd
- 10471 River Rd
- 10605 River Rd