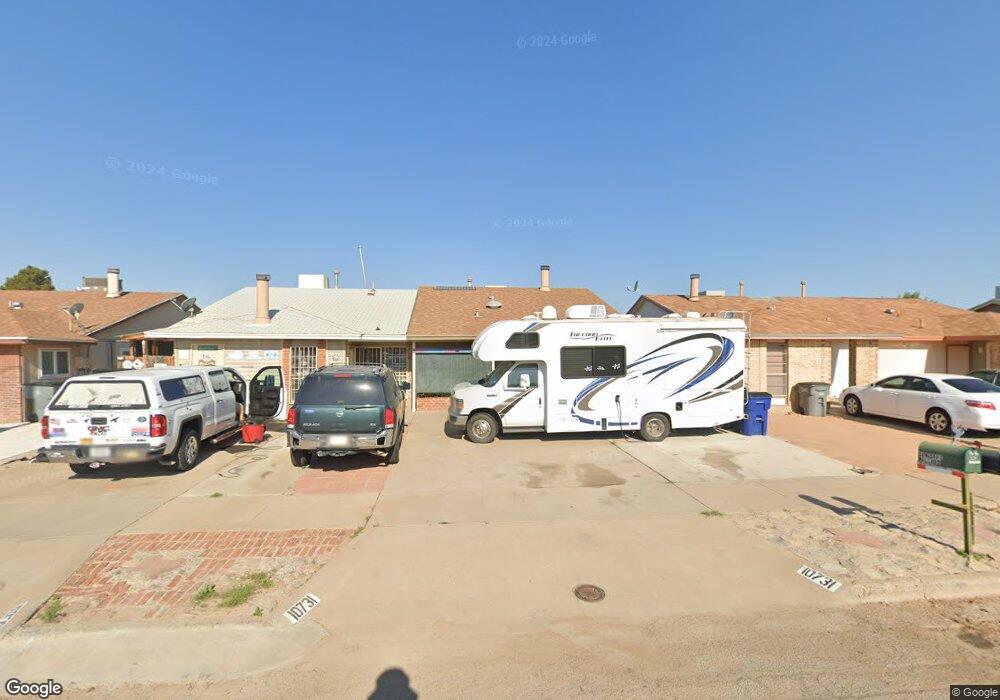
10731 Chert St Unit 2 El Paso, TX 79924
Shearman Park NeighborhoodEstimated Value: $99,019 - $153,000
2
Beds
1
Bath
881
Sq Ft
$137/Sq Ft
Est. Value
About This Home
This home is located at 10731 Chert St Unit 2, El Paso, TX 79924 and is currently estimated at $121,005, approximately $137 per square foot. 10731 Chert St Unit 2 is a home located in El Paso County with nearby schools including Desertaire Elementary School, Parkland Pre-Engineering Middle School, and Parkland High School.
Ownership History
Date
Name
Owned For
Owner Type
Purchase Details
Closed on
Sep 22, 2025
Sold by
Donald P Mallard Trust and Mallard Jason
Bought by
Sanchez Erik
Current Estimated Value
Home Financials for this Owner
Home Financials are based on the most recent Mortgage that was taken out on this home.
Original Mortgage
$191,000
Outstanding Balance
$190,827
Interest Rate
6.5%
Mortgage Type
VA
Estimated Equity
-$69,822
Purchase Details
Closed on
Jun 14, 2021
Sold by
Rbd Properties Llc
Bought by
Mallard Donald P
Purchase Details
Closed on
Sep 30, 2009
Sold by
Mallard Timothy C and Mallard Velma J
Bought by
Soto Juan
Purchase Details
Closed on
Dec 30, 1998
Sold by
Schroder John F
Bought by
Mallard Timothy C and Mallard Velma J
Home Financials for this Owner
Home Financials are based on the most recent Mortgage that was taken out on this home.
Original Mortgage
$31,571
Interest Rate
6.85%
Create a Home Valuation Report for This Property
The Home Valuation Report is an in-depth analysis detailing your home's value as well as a comparison with similar homes in the area
Home Values in the Area
Average Home Value in this Area
Purchase History
| Date | Buyer | Sale Price | Title Company |
|---|---|---|---|
| Sanchez Erik | -- | None Listed On Document | |
| Mallard Donald P | -- | None Available | |
| Soto Juan | -- | None Available | |
| Mallard Timothy C | -- | -- |
Source: Public Records
Mortgage History
| Date | Status | Borrower | Loan Amount |
|---|---|---|---|
| Open | Sanchez Erik | $191,000 | |
| Previous Owner | Mallard Timothy C | $31,571 |
Source: Public Records
Tax History Compared to Growth
Tax History
| Year | Tax Paid | Tax Assessment Tax Assessment Total Assessment is a certain percentage of the fair market value that is determined by local assessors to be the total taxable value of land and additions on the property. | Land | Improvement |
|---|---|---|---|---|
| 2025 | $2,908 | $124,001 | $28,980 | $95,021 |
| 2024 | $2,908 | $105,889 | $10,868 | $95,021 |
| 2023 | $2,908 | $93,727 | $10,868 | $82,859 |
| 2022 | $2,540 | $81,798 | $10,868 | $70,930 |
| 2021 | $1,897 | $58,356 | $10,868 | $47,488 |
| 2020 | $1,612 | $51,022 | $7,390 | $43,632 |
| 2018 | $1,379 | $44,343 | $7,390 | $36,953 |
| 2017 | $1,333 | $43,617 | $7,390 | $36,227 |
| 2016 | $1,453 | $47,545 | $7,390 | $40,155 |
| 2015 | $1,360 | $47,545 | $7,390 | $40,155 |
| 2014 | $1,360 | $47,545 | $7,390 | $40,155 |
Source: Public Records
Map
Nearby Homes
- 10801 Rhyolite Dr
- 6688 Tiger Eye Dr
- 6696 Tiger Eye Dr
- 10821 Quartz St
- 10812 Obsidian St
- 10829 Obsidian St
- 10653 Silvercloud Dr
- 10813 Onyxstone St
- 10821 Onyxstone St
- 6601 Malachite Ct
- 10808 Opalstone St
- 10824 Opalstone St
- 10725 Silvercloud Dr
- 10724 Sunstone St
- 10793 Blue Sage Cir
- 10613 Obsidian St
- 10733 Tourmaline St
- 10732 Sapphire St
- 10812 Aquamarine St
- 10708 Aquamarine St
- 10729, 107 Chert St
- 10733 Chert St
- 10729 Chert St
- 10735 Chert St
- 10727 Chert St
- 10737 Chert St
- 10725 Chert St
- 10732 Quartz St
- 10728 Quartz St
- 10739 Chert St
- 10723 Chert St
- 10736 Quartz St
- 10724 Quartz St
- 10741 Chert St
- 10721 Chert St
- 10730 Chert St
- 10732 Chert St
- 10728 Chert St
- 10728 Chert St
- 10734 Chert St