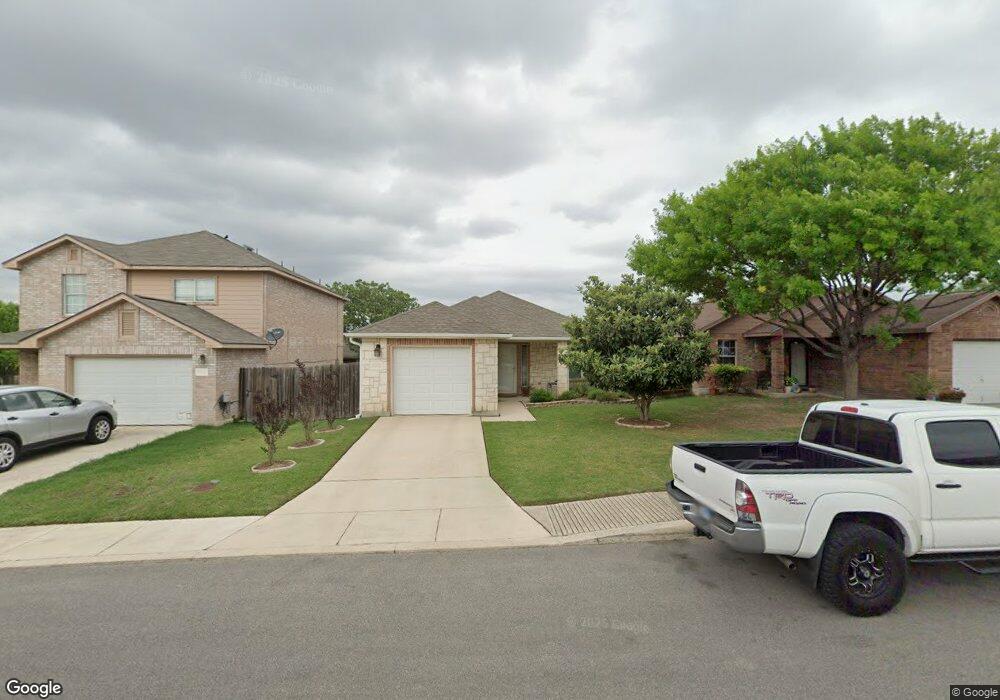
10731 Shaencrest San Antonio, TX 78254
Estimated Value: $218,694 - $238,000
3
Beds
2
Baths
1,249
Sq Ft
$181/Sq Ft
Est. Value
About This Home
This home is located at 10731 Shaencrest, San Antonio, TX 78254 and is currently estimated at $225,924, approximately $180 per square foot. 10731 Shaencrest is a home located in Bexar County with nearby schools including Fields Elementary, Jefferson Middle School, and School of Science and Technology Hill Country.
Ownership History
Date
Name
Owned For
Owner Type
Purchase Details
Closed on
Sep 26, 2014
Sold by
Sosa Milagros and Antequera Diane
Bought by
Ortiz Stefanie E
Current Estimated Value
Home Financials for this Owner
Home Financials are based on the most recent Mortgage that was taken out on this home.
Original Mortgage
$126,530
Outstanding Balance
$97,146
Interest Rate
4.14%
Mortgage Type
New Conventional
Estimated Equity
$128,778
Purchase Details
Closed on
Dec 3, 2012
Sold by
Sosa Ernesto and Sosa Milagros
Bought by
Sosa Milagros and Antequera Diane
Purchase Details
Closed on
Nov 27, 2006
Sold by
Lopez Erica N and Lopez Erica Carter
Bought by
Sosa Ernesto and Sosa Milagros
Purchase Details
Closed on
Sep 19, 2003
Sold by
Obra Homes Inc
Bought by
Lopez Erica N
Home Financials for this Owner
Home Financials are based on the most recent Mortgage that was taken out on this home.
Original Mortgage
$87,530
Interest Rate
6.42%
Mortgage Type
Purchase Money Mortgage
Create a Home Valuation Report for This Property
The Home Valuation Report is an in-depth analysis detailing your home's value as well as a comparison with similar homes in the area
Home Values in the Area
Average Home Value in this Area
Purchase History
| Date | Buyer | Sale Price | Title Company |
|---|---|---|---|
| Ortiz Stefanie E | -- | None Available | |
| Sosa Milagros | -- | None Available | |
| Sosa Ernesto | -- | Lalt | |
| Lopez Erica N | -- | -- |
Source: Public Records
Mortgage History
| Date | Status | Borrower | Loan Amount |
|---|---|---|---|
| Open | Ortiz Stefanie E | $126,530 | |
| Previous Owner | Lopez Erica N | $87,530 |
Source: Public Records
Tax History Compared to Growth
Tax History
| Year | Tax Paid | Tax Assessment Tax Assessment Total Assessment is a certain percentage of the fair market value that is determined by local assessors to be the total taxable value of land and additions on the property. | Land | Improvement |
|---|---|---|---|---|
| 2025 | $2,794 | $226,670 | $45,360 | $181,310 |
| 2024 | $2,794 | $219,682 | $45,360 | $181,310 |
| 2023 | $2,794 | $199,711 | $45,360 | $181,110 |
| 2022 | $3,688 | $181,555 | $37,840 | $165,650 |
| 2021 | $3,475 | $165,050 | $34,430 | $130,620 |
| 2020 | $3,343 | $155,430 | $34,430 | $121,000 |
| 2019 | $3,316 | $149,320 | $25,870 | $123,450 |
| 2018 | $3,129 | $140,790 | $25,870 | $114,920 |
| 2017 | $3,032 | $136,140 | $25,870 | $110,270 |
| 2016 | $2,758 | $123,827 | $25,870 | $100,030 |
| 2015 | -- | $112,570 | $20,530 | $92,040 |
Source: Public Records
Map
Nearby Homes
- 9011 Mustang Pass
- 10726 N Shaenridge
- 10703 Spirit Roam
- 8827 Gallop Chase
- 9218 Mare Country
- 8611 Shaenfield Place
- 9103 Mare Trace
- 10727 Shaencrossing
- 9103 Mare Hunt
- 10814 Mustang Oak Dr
- 8515 Shaenfield Place
- 14418 Galloping Colt
- 14426 Galloping Colt
- 14504 Galloping Colt
- 9003 Canter Horse
- 9216 Dublin Green
- 10614 Emory Quinn
- 9407 Pegasus Run Rd
- 11003 Dublin Briar
- 11006 Colt Isle
- 10727 Shaencrest
- 10735 Shaencrest
- 10723 Shaencrest
- 10730 Shaenmeadow
- 10726 Shaenmeadow
- 10734 Shaenmeadow
- 10719 Shaencrest
- 10722 Shaenmeadow
- 10730 Shaencrest
- 10734 Shaencrest
- 10726 Shaencrest
- 10718 Shaenmeadow
- 10715 Shaencrest
- 8911 Shaenwest
- 8915 Shaenwest
- 10722 Shaencrest
- 8919 Shaenwest
- 10714 Shaenmeadow
- 10718 Shaencrest
- 10711 Shaencrest