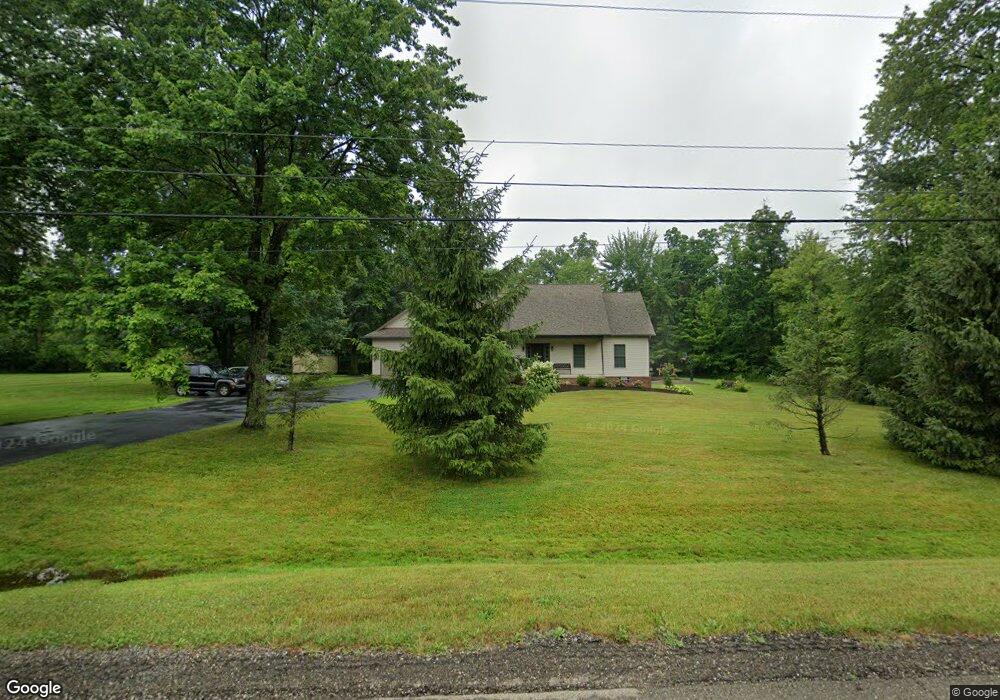
10732 Columbiana Canfield Rd Canfield, OH 44406
Estimated Value: $432,000 - $520,000
3
Beds
3
Baths
2,120
Sq Ft
$218/Sq Ft
Est. Value
About This Home
This home is located at 10732 Columbiana Canfield Rd, Canfield, OH 44406 and is currently estimated at $462,447, approximately $218 per square foot. 10732 Columbiana Canfield Rd is a home located in Mahoning County with nearby schools including South Range Elementary School, South Range Middle School, and South Range High School.
Ownership History
Date
Name
Owned For
Owner Type
Purchase Details
Closed on
Dec 17, 2019
Bought by
Scenna Patrick O Trustee
Current Estimated Value
Purchase Details
Closed on
Sep 8, 2017
Sold by
Stellers Burt
Bought by
Scenna Patrick O and Scenna Sarah J
Home Financials for this Owner
Home Financials are based on the most recent Mortgage that was taken out on this home.
Original Mortgage
$241,200
Interest Rate
3.93%
Mortgage Type
New Conventional
Purchase Details
Closed on
May 14, 2014
Sold by
Stellers Burt and Stellers Jill
Bought by
Stellers Burt
Purchase Details
Closed on
Aug 11, 2006
Sold by
Wilson Susan M and Wilson Timothy M
Bought by
Ayers Marie
Purchase Details
Closed on
Aug 10, 2004
Sold by
Duponty James V and Duponty Anthony R
Bought by
Wilson Timothy M and Wilson Susan M
Purchase Details
Closed on
Jan 3, 1967
Bought by
Duponty James and A M
Create a Home Valuation Report for This Property
The Home Valuation Report is an in-depth analysis detailing your home's value as well as a comparison with similar homes in the area
Home Values in the Area
Average Home Value in this Area
Purchase History
| Date | Buyer | Sale Price | Title Company |
|---|---|---|---|
| Scenna Patrick O Trustee | -- | -- | |
| Scenna Patrick O | $268,000 | None Available | |
| Stellers Burt | -- | Attorney | |
| Ayers Marie | -- | None Available | |
| Wilson Timothy M | $47,000 | -- | |
| Duponty James | -- | -- |
Source: Public Records
Mortgage History
| Date | Status | Borrower | Loan Amount |
|---|---|---|---|
| Previous Owner | Scenna Patrick O | $241,200 |
Source: Public Records
Tax History Compared to Growth
Tax History
| Year | Tax Paid | Tax Assessment Tax Assessment Total Assessment is a certain percentage of the fair market value that is determined by local assessors to be the total taxable value of land and additions on the property. | Land | Improvement |
|---|---|---|---|---|
| 2024 | $4,956 | $107,440 | $16,960 | $90,480 |
| 2023 | $4,973 | $107,440 | $16,960 | $90,480 |
| 2022 | $4,891 | $91,610 | $14,900 | $76,710 |
| 2021 | $4,767 | $91,610 | $14,900 | $76,710 |
| 2020 | $4,790 | $91,610 | $14,900 | $76,710 |
| 2019 | $4,141 | $75,780 | $14,900 | $60,880 |
| 2018 | $4,156 | $75,780 | $14,900 | $60,880 |
| 2017 | $4,109 | $75,780 | $14,900 | $60,880 |
| 2016 | $4,065 | $72,560 | $15,580 | $56,980 |
| 2015 | $3,919 | $72,560 | $15,580 | $56,980 |
| 2014 | $3,999 | $72,560 | $15,580 | $56,980 |
| 2013 | $3,970 | $72,560 | $15,580 | $56,980 |
Source: Public Records
Map
Nearby Homes
- 5779 W Middletown Rd
- 11375 Fox Run Ln
- 6604 W Middletown Rd
- 10396 Detwiler Rd
- 11158 Detwiler Rd
- 9256 Columbiana Canfield Rd
- 12157 Columbiana Canfield Rd
- 10473 Lisbon Rd
- 9974 New Buffalo Rd
- 6605 Covington Cove
- 3555 W South Range Rd
- 7060 W South Range Rd
- 7145 W South Range Rd
- 3079 W South Range Rd
- 3396 W Western Reserve Rd
- 9501 New Buffalo Rd
- 8075 S Raccoon Rd
- 2680 W South Range Rd
- 5060 Leffingwell Rd
- 4808 Leffingwell Rd
- 10776 Columbiana Canfield Rd
- 10700 Columbiana Canfield Rd
- 10545 Columbiana Canfield Rd
- 10575 Columbiana Canfield Rd
- 10590 Columbiana-Canfield Rd
- 5190 W Middletown Rd
- 11016 Green Beaver Rd
- 5284 W Middletown Rd
- 5176 W Middletown Rd
- 11039 Green Beaver Rd
- 5220 W Middletown Rd
- 1 Green Beaver
- 4900 W Middletown Rd
- 4984 W Middletown Rd
- 4950 W Middletown Rd
- 0 W Middletown Rd
- 5540 Timberwood Trail
- 5406 W Middletown Rd
- 5545 Timberwood Trail
- 5173 W Middletown Rd