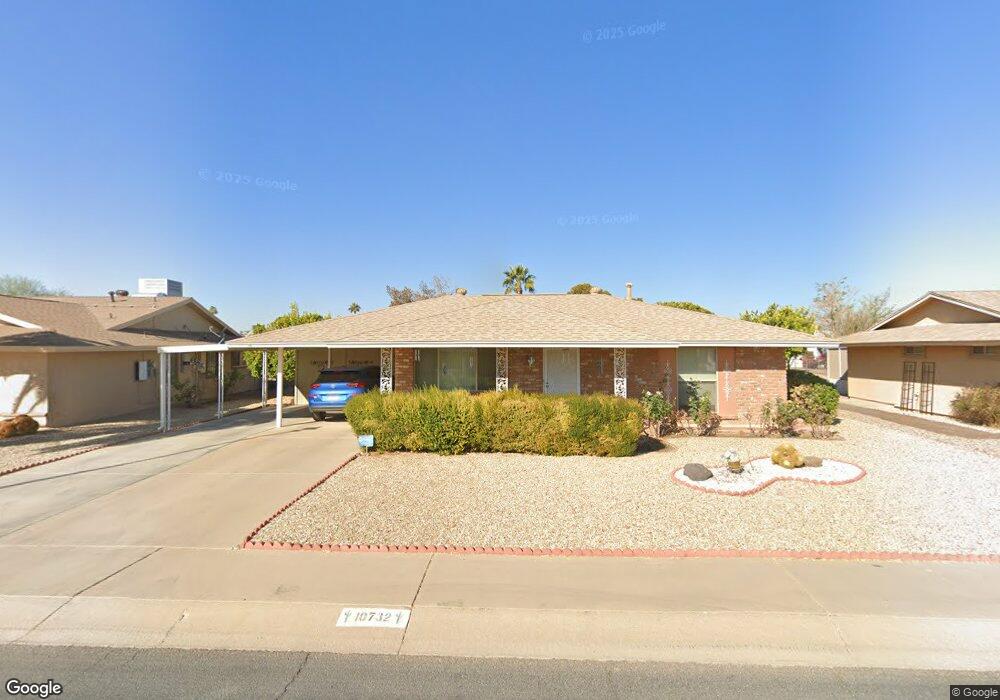
10732 W El Capitan Cir Sun City, AZ 85351
Estimated Value: $206,646 - $289,000
--
Bed
1
Bath
995
Sq Ft
$248/Sq Ft
Est. Value
About This Home
This home is located at 10732 W El Capitan Cir, Sun City, AZ 85351 and is currently estimated at $246,912, approximately $248 per square foot. 10732 W El Capitan Cir is a home located in Maricopa County with nearby schools including Desert Mirage Elementary School.
Ownership History
Date
Name
Owned For
Owner Type
Purchase Details
Closed on
Nov 28, 2006
Sold by
Tedder Norward
Bought by
Sellens Cynthia A
Current Estimated Value
Home Financials for this Owner
Home Financials are based on the most recent Mortgage that was taken out on this home.
Original Mortgage
$58,500
Outstanding Balance
$34,801
Interest Rate
6.22%
Mortgage Type
New Conventional
Estimated Equity
$212,111
Purchase Details
Closed on
Feb 8, 2002
Sold by
Sprague Carol J
Bought by
Lippens Shirley J
Home Financials for this Owner
Home Financials are based on the most recent Mortgage that was taken out on this home.
Original Mortgage
$52,000
Interest Rate
6.8%
Mortgage Type
New Conventional
Purchase Details
Closed on
Jul 31, 2000
Sold by
Fritz Anna G and Perry & Anna G Fritz Trust
Bought by
Sprague Carol J
Home Financials for this Owner
Home Financials are based on the most recent Mortgage that was taken out on this home.
Original Mortgage
$50,000
Interest Rate
8.07%
Mortgage Type
New Conventional
Create a Home Valuation Report for This Property
The Home Valuation Report is an in-depth analysis detailing your home's value as well as a comparison with similar homes in the area
Home Values in the Area
Average Home Value in this Area
Purchase History
| Date | Buyer | Sale Price | Title Company |
|---|---|---|---|
| Sellens Cynthia A | $138,500 | The Talon Group Tramonto | |
| Lippens Shirley J | $72,900 | First American Title | |
| Sprague Carol J | $65,000 | Capital Title Agency |
Source: Public Records
Mortgage History
| Date | Status | Borrower | Loan Amount |
|---|---|---|---|
| Open | Sellens Cynthia A | $58,500 | |
| Previous Owner | Lippens Shirley J | $52,000 | |
| Previous Owner | Sprague Carol J | $50,000 |
Source: Public Records
Tax History Compared to Growth
Tax History
| Year | Tax Paid | Tax Assessment Tax Assessment Total Assessment is a certain percentage of the fair market value that is determined by local assessors to be the total taxable value of land and additions on the property. | Land | Improvement |
|---|---|---|---|---|
| 2025 | $647 | $8,124 | -- | -- |
| 2024 | $590 | $7,737 | -- | -- |
| 2023 | $590 | $16,520 | $3,300 | $13,220 |
| 2022 | $555 | $12,860 | $2,570 | $10,290 |
| 2021 | $573 | $11,820 | $2,360 | $9,460 |
| 2020 | $558 | $10,080 | $2,010 | $8,070 |
| 2019 | $548 | $9,130 | $1,820 | $7,310 |
| 2018 | $533 | $8,020 | $1,600 | $6,420 |
| 2017 | $512 | $7,000 | $1,400 | $5,600 |
| 2016 | $484 | $6,510 | $1,300 | $5,210 |
| 2015 | $462 | $5,720 | $1,140 | $4,580 |
Source: Public Records
Map
Nearby Homes
- 10734 W El Capitan Cir
- 10722 W El Capitan Cir
- 10739 W Saratoga Cir
- 10760 W Saratoga Cir
- 10733 W Saratoga Cir
- 10710 W El Capitan Cir
- 10701 W El Capitan Cir
- 10611 W Camelot Cir
- 10731 W Tropicana Cir
- 10720 W Saratoga Cir
- 10617 W El Capitan Cir Unit 23
- 10921 W El Capitan Cir Unit 11
- 10837 W Tropicana Cir
- 10907 W Saratoga Cir
- 10722 W Tropicana Cir
- 10820 W Sarabande Cir
- 10611 W El Capitan Cir Unit 26
- 10415 W Camelot Cir
- 10607 W El Capitan Cir
- 10428 W Camelot Cir Unit 12
- 10730 W El Capitan Cir
- 10741 W Roundelay Cir
- 10739 W Roundelay Cir
- 10743 W Roundelay Cir
- 10728 W El Capitan Cir
- 10736 W El Capitan Cir
- 10731 W El Capitan Cir
- 10737 W Roundelay Cir Unit 11
- 10733 W El Capitan Cir
- 10729 W El Capitan Cir
- 10745 W Roundelay Cir
- 10733 W Roundelay Cir
- 10726 W El Capitan Cir
- 10735 W El Capitan Cir
- 10738 W El Capitan Cir
- 10727 W El Capitan Cir
- 10747 W Roundelay Cir
- 10740 W Roundelay Cir
- 10722 W Camelot Cir Unit 11
- 10724 W Camelot Cir