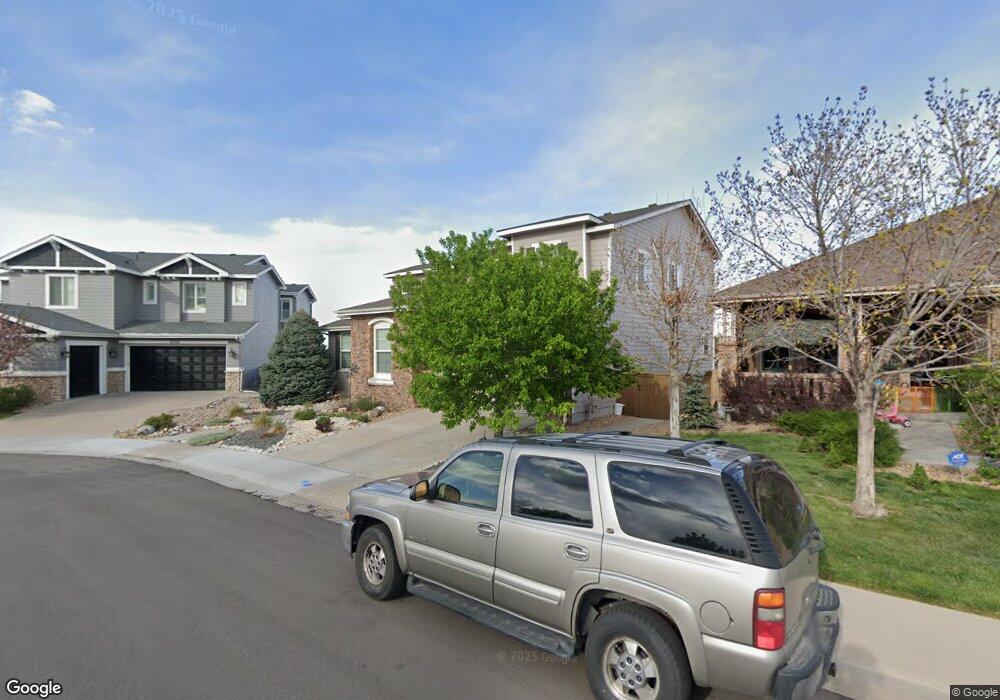
10734 Fairbairn Way Highlands Ranch, CO 80130
Southridge NeighborhoodEstimated Value: $1,093,962 - $1,277,000
4
Beds
4
Baths
5,421
Sq Ft
$213/Sq Ft
Est. Value
About This Home
This home is located at 10734 Fairbairn Way, Highlands Ranch, CO 80130 and is currently estimated at $1,153,991, approximately $212 per square foot. 10734 Fairbairn Way is a home located in Douglas County with nearby schools including Wildcat Mountain Elementary School, Rocky Heights Middle School, and Rock Canyon High School.
Ownership History
Date
Name
Owned For
Owner Type
Purchase Details
Closed on
Jan 15, 2016
Sold by
Johnson Matthew T and Johnson Simone A
Bought by
Shah Chiraag Satish and Shah Swetha C
Current Estimated Value
Home Financials for this Owner
Home Financials are based on the most recent Mortgage that was taken out on this home.
Original Mortgage
$417,000
Outstanding Balance
$331,866
Interest Rate
3.98%
Mortgage Type
New Conventional
Estimated Equity
$822,125
Purchase Details
Closed on
Mar 19, 2007
Sold by
Shea Homes Lp
Bought by
Johnson Matthew T and Johnson Simone A
Home Financials for this Owner
Home Financials are based on the most recent Mortgage that was taken out on this home.
Original Mortgage
$500,090
Interest Rate
6.3%
Mortgage Type
Unknown
Create a Home Valuation Report for This Property
The Home Valuation Report is an in-depth analysis detailing your home's value as well as a comparison with similar homes in the area
Home Values in the Area
Average Home Value in this Area
Purchase History
| Date | Buyer | Sale Price | Title Company |
|---|---|---|---|
| Shah Chiraag Satish | $635,000 | Fidelity National Title | |
| Johnson Matthew T | $625,113 | Fahtco |
Source: Public Records
Mortgage History
| Date | Status | Borrower | Loan Amount |
|---|---|---|---|
| Open | Shah Chiraag Satish | $417,000 | |
| Previous Owner | Johnson Matthew T | $500,090 |
Source: Public Records
Tax History Compared to Growth
Tax History
| Year | Tax Paid | Tax Assessment Tax Assessment Total Assessment is a certain percentage of the fair market value that is determined by local assessors to be the total taxable value of land and additions on the property. | Land | Improvement |
|---|---|---|---|---|
| 2024 | $7,895 | $87,460 | $13,400 | $74,060 |
| 2023 | $7,881 | $87,460 | $13,400 | $74,060 |
| 2022 | $4,984 | $54,550 | $9,760 | $44,790 |
| 2021 | $5,184 | $54,550 | $9,760 | $44,790 |
| 2020 | $4,917 | $53,020 | $9,570 | $43,450 |
| 2019 | $4,936 | $53,020 | $9,570 | $43,450 |
| 2018 | $4,839 | $51,200 | $9,170 | $42,030 |
| 2017 | $4,406 | $51,200 | $9,170 | $42,030 |
| 2016 | $4,622 | $52,720 | $8,920 | $43,800 |
| 2015 | $4,722 | $52,720 | $8,920 | $43,800 |
| 2014 | $4,601 | $47,430 | $7,960 | $39,470 |
Source: Public Records
Map
Nearby Homes
- 4965 Huntwick Place
- 11036 Glengate Cir
- 10645 Cedarcrest Cir
- 10754 Towerbridge Cir
- 5300 Fullerton Ln
- 10497 Wagon Box Cir
- 10660 Jewelberry Cir
- 10547 Laurelglen Cir
- 4821 Bluegate Dr
- 4656 Ketchwood Cir
- 10653 Briarglen Cir
- 10896 Valleybrook Cir
- 10881 Glengate Cir
- 11074 Grayledge Cir
- 5639 Jaguar Way
- 10360 Tracewood Ct
- 6042 Sima Cir
- 5001 Laurelglen Ln
- 10557 Eby Cir
- 10557 Jaguar Dr
- 10742 Fairbairn Way
- 10726 Fairbairn Way
- 10725 Fairbairn Way
- 10760 Fairbairn Way
- 10741 Fairbairn Way
- 10755 Fairbairn Way
- 10731 Fairbairn Way
- 11089 Glengate Cir
- 11085 Glengate Cir
- 5028 Wagon Box Place
- 10750 Huntwick St
- 11096 Glengate Cir
- 11092 Glengate Cir
- 5040 Wagon Box Place
- 11100 Glengate Cir
- 5014 Wagon Box Place
- 11081 Glengate Cir
- 11086 Glengate Cir
- 10758 Huntwick St
- 5000 Wagon Box Place