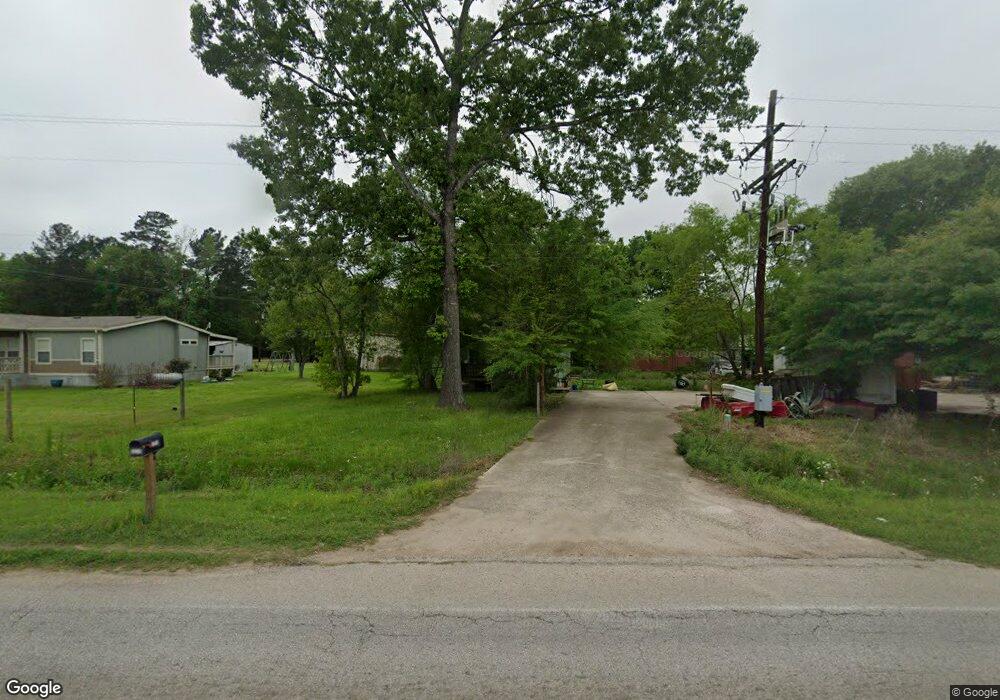
10734 Fostoria Rd Cleveland, TX 77328
Estimated Value: $108,593 - $437,000
3
Beds
2
Baths
1,008
Sq Ft
$261/Sq Ft
Est. Value
About This Home
This home is located at 10734 Fostoria Rd, Cleveland, TX 77328 and is currently estimated at $262,898, approximately $260 per square foot. 10734 Fostoria Rd is a home located in Montgomery County with nearby schools including Splendora High School.
Ownership History
Date
Name
Owned For
Owner Type
Purchase Details
Closed on
Feb 7, 2020
Sold by
Wooten Mary Smith
Bought by
Wooten Jim
Current Estimated Value
Home Financials for this Owner
Home Financials are based on the most recent Mortgage that was taken out on this home.
Original Mortgage
$18,000
Outstanding Balance
$15,938
Interest Rate
3.6%
Mortgage Type
Seller Take Back
Estimated Equity
$246,960
Purchase Details
Closed on
Aug 29, 2007
Sold by
Woods Joe Ford and Goglas Woods Kathy
Bought by
Wooten Jim B and Wooten Mary C
Purchase Details
Closed on
May 1, 2001
Sold by
Cunningham Gerald W
Bought by
Wooten Jim B
Purchase Details
Closed on
Aug 21, 1997
Sold by
Lee Franklin S
Bought by
Wooten Jim B
Home Financials for this Owner
Home Financials are based on the most recent Mortgage that was taken out on this home.
Original Mortgage
$33,500
Interest Rate
7.46%
Create a Home Valuation Report for This Property
The Home Valuation Report is an in-depth analysis detailing your home's value as well as a comparison with similar homes in the area
Home Values in the Area
Average Home Value in this Area
Purchase History
| Date | Buyer | Sale Price | Title Company |
|---|---|---|---|
| Wooten Jim | -- | None Available | |
| Wooten Jim B | -- | Stewart Title Company | |
| Wooten Jim B | -- | -- | |
| Wooten Jim B | -- | -- | |
| Cunningham Gerald W | -- | First Surety Title |
Source: Public Records
Mortgage History
| Date | Status | Borrower | Loan Amount |
|---|---|---|---|
| Open | Wooten Jim | $18,000 | |
| Previous Owner | Cunningham Gerald W | $33,500 |
Source: Public Records
Tax History Compared to Growth
Tax History
| Year | Tax Paid | Tax Assessment Tax Assessment Total Assessment is a certain percentage of the fair market value that is determined by local assessors to be the total taxable value of land and additions on the property. | Land | Improvement |
|---|---|---|---|---|
| 2025 | $1,396 | $78,287 | $33,540 | $44,747 |
| 2024 | $1,358 | $73,895 | $33,540 | $40,355 |
| 2023 | $1,358 | $74,250 | $33,540 | $40,710 |
| 2022 | $1,223 | $60,830 | $20,120 | $40,710 |
| 2021 | $977 | $47,030 | $16,770 | $30,260 |
| 2020 | $1,041 | $47,030 | $16,770 | $30,260 |
| 2019 | $1,107 | $47,420 | $26,830 | $20,590 |
| 2018 | $1,107 | $47,420 | $26,830 | $20,590 |
| 2017 | $1,110 | $47,420 | $26,830 | $20,590 |
| 2016 | $639 | $27,300 | $6,710 | $20,590 |
| 2015 | $524 | $25,290 | $4,700 | $20,590 |
| 2014 | $524 | $25,290 | $4,700 | $20,590 |
Source: Public Records
Map
Nearby Homes
- 000 Fostoria Rd
- 10994 Fostoria Rd
- 26864 Morgan Cemetery Rd
- 10863 Autumn Ln
- 10511 Fostoria Rd
- 10488 Fostoria Rd
- 11121 Fostoria Rd
- 905 County Road 379
- 25992 Liberation Rd
- 25980 Liberation Rd
- 11053 Patriot Ct
- 11304 Fostoria Rd
- 10205 Fostoria Rd
- 10931 Independence Rd
- 10935 Independence Rd
- 10943 Independence Rd
- 10938 Independence Rd
- San Jacinto Plan at Liberty Estates
- Matagorda Plan at Liberty Estates
- Truman Plan at Liberty Estates
- 10790 Fostoria Rd
- 10790 Fostoria Rd
- 26665 Morgan Cemetery Rd
- 26782 Morgan Cemetery Rd
- 10652 Fostoria Rd
- 10880 Fostoria Rd
- 26579 Morgan Cemetery Rd
- 26724 Morgan Cemetery Rd
- 10646 Fostoria Rd
- 10845 Autumn Ln
- 0 Fostoria Unit 99283408
- 0 Fostoria Unit 8257654
- 0 Fostoria Unit 7113037
- 0 Fostoria Unit 28071810
- 0 Fostoria Unit 3017604
- 0 Fostoria Unit 86038234
- 0 Fostoria Unit 18550330
- 10620 Fostoria Rd
- 10859 Autumn Ln
- 10834 Autumn Ln