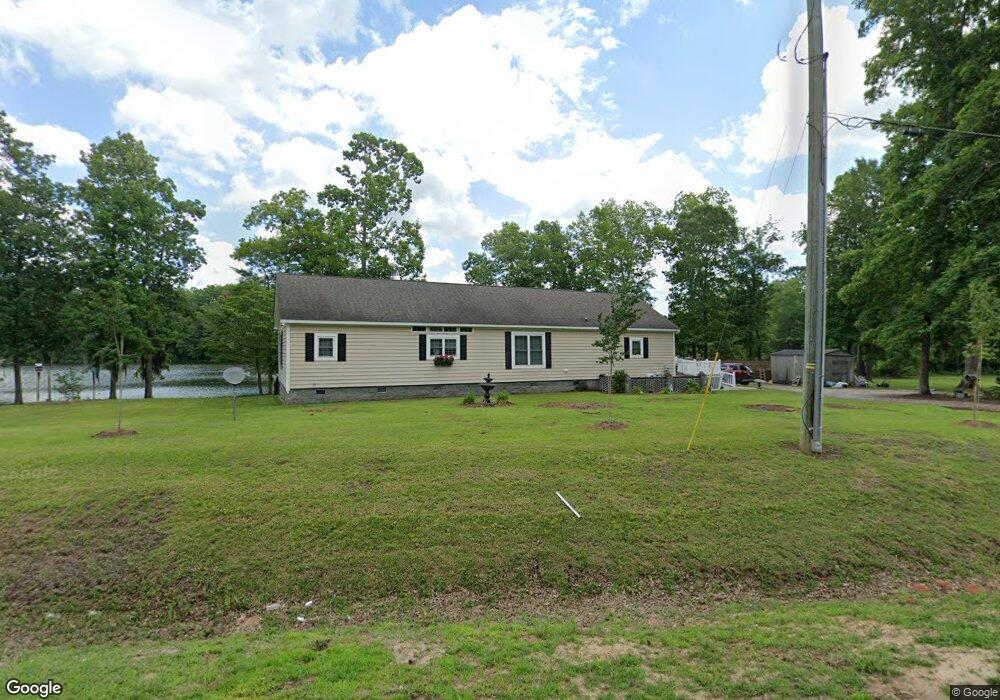
10739 Highway 260 Manning, SC 29102
Estimated Value: $305,000 - $462,000
--
Bed
--
Bath
1,932
Sq Ft
$199/Sq Ft
Est. Value
About This Home
This home is located at 10739 Highway 260, Manning, SC 29102 and is currently estimated at $384,246, approximately $198 per square foot. 10739 Highway 260 is a home located in Clarendon County with nearby schools including Manning Early Childhood Center, Manning Primary School, and Manning Elementary School.
Ownership History
Date
Name
Owned For
Owner Type
Purchase Details
Closed on
Mar 6, 2024
Sold by
Dominici James S
Bought by
Coker Angela E
Current Estimated Value
Purchase Details
Closed on
Sep 21, 2020
Sold by
Coker Angela E
Bought by
Coker Angela E and Dominici James S
Home Financials for this Owner
Home Financials are based on the most recent Mortgage that was taken out on this home.
Original Mortgage
$230,000
Interest Rate
2.9%
Mortgage Type
New Conventional
Purchase Details
Closed on
Apr 5, 2013
Sold by
Lopez Lucille H
Bought by
Coker Angela E
Home Financials for this Owner
Home Financials are based on the most recent Mortgage that was taken out on this home.
Original Mortgage
$160,000
Interest Rate
3.57%
Mortgage Type
New Conventional
Purchase Details
Closed on
Jul 28, 2006
Sold by
Bmmw Inc
Bought by
Lopez Lucille H
Create a Home Valuation Report for This Property
The Home Valuation Report is an in-depth analysis detailing your home's value as well as a comparison with similar homes in the area
Home Values in the Area
Average Home Value in this Area
Purchase History
| Date | Buyer | Sale Price | Title Company |
|---|---|---|---|
| Coker Angela E | -- | None Listed On Document | |
| Coker Angela E | -- | None Available | |
| Coker Angela E | $200,000 | None Available | |
| Lopez Lucille H | $365,000 | None Available |
Source: Public Records
Mortgage History
| Date | Status | Borrower | Loan Amount |
|---|---|---|---|
| Previous Owner | Coker Angela E | $230,000 | |
| Previous Owner | Coker Angela E | $160,000 |
Source: Public Records
Tax History Compared to Growth
Tax History
| Year | Tax Paid | Tax Assessment Tax Assessment Total Assessment is a certain percentage of the fair market value that is determined by local assessors to be the total taxable value of land and additions on the property. | Land | Improvement |
|---|---|---|---|---|
| 2024 | $1,715 | $8,432 | $4,408 | $4,024 |
| 2023 | $1,681 | $9,564 | $5,000 | $4,564 |
| 2022 | $4,830 | $9,564 | $5,000 | $4,564 |
| 2021 | $1,398 | $10,998 | $4,800 | $6,198 |
| 2020 | $1,398 | $7,332 | $3,200 | $4,132 |
| 2019 | $1,295 | $7,332 | $3,200 | $4,132 |
| 2018 | $1,217 | $7,332 | $0 | $0 |
| 2017 | $1,217 | $7,332 | $0 | $0 |
| 2016 | $1,178 | $7,332 | $0 | $0 |
| 2015 | $2,021 | $12,404 | $8,000 | $4,404 |
| 2014 | $1,990 | $12,404 | $8,000 | $4,404 |
| 2013 | -- | $12,759 | $4,761 | $7,998 |
Source: Public Records
Map
Nearby Homes
- 1156 W A Gamble Rd
- 1386 Forest Lake Dr
- 1063 Birdie Ct
- 0 Herring Dr Unit 25021862
- 0 Herring Dr Unit 200197
- 2112 Lake Shore Dr
- 1030 Levi St
- 1044 Levi St
- 1075 Mockingbird Ln
- 2193 Lake Shore Dr
- 1129 Levi St
- 1193 Newman Cir
- 1401 Charles Dr
- 1407 Edmonds Way
- 1062 Manning Dr
- 1665 Lake Shore Dr
- 1677 Clearview Dr
- 1446 Litzler Dr
- 1537 Litzler Dr
- 1390 Nightfall Ln
- 10739 Hwy 260
- 10739 S Carolina 260
- 1010 Dobson Dr
- 1024 Dobson Dr
- 1044 Dobson Dr
- 1058 Dobson Dr
- 10841 Hwy 260
- 10828 Hwy 260
- 10828 S Carolina 260
- 1072 Dobson Dr
- 10846 S Carolina 260
- 1078 Dobson Dr
- 2168 James Loop Rd
- 2146 James Loop Rd
- 1086 Shore Dr
- 1088 Shore Dr
- 0 Carving Trace Dr Unit 110927
- 0 Carving Trace Dr Unit 16000618
- 1010 James Loop Rd
- 1084 Durant Ln