M
Seller's Agent in 2024
Michael Cain
RE/MAX
(812) 228-5488
1 in this area
7 Total Sales
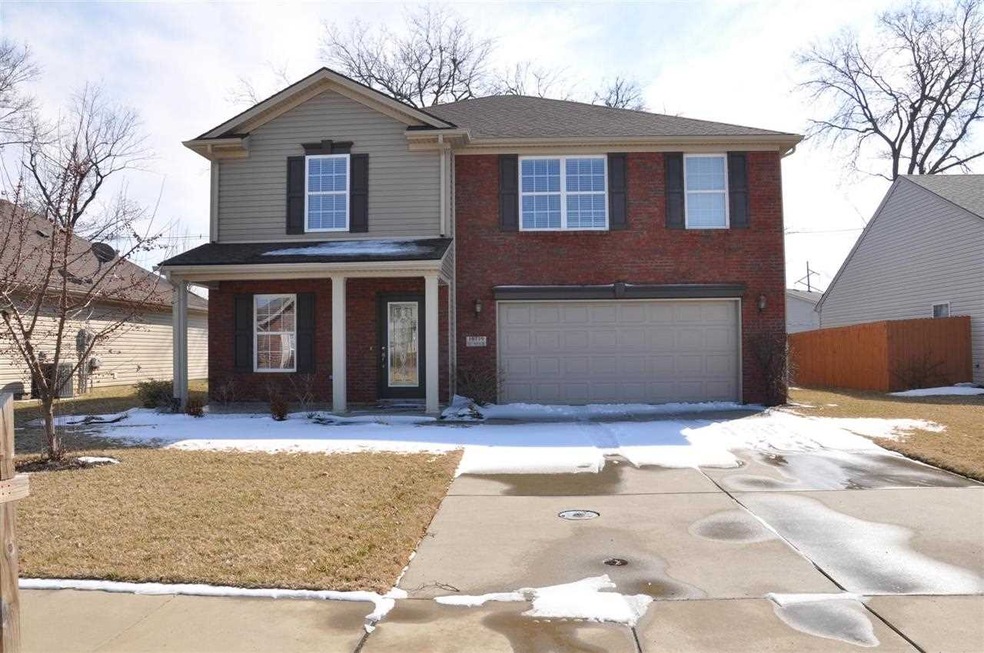


This home is located at 10739 Tecumseh Dr, Newburgh, IN 47630 and is currently priced at $185,500, approximately $77 per square foot. This property was built in 2008. 10739 Tecumseh Dr is a home located in Warrick County with nearby schools including Newburgh Elementary School, Castle North Middle School, and Castle High School.
Last Agent to Sell the Property
CHRIS WILLIAMS
F.C. TUCKER EMGE Listed on: 03/03/2014

| Date | Type | Sale Price | Title Company |
|---|---|---|---|
| Warranty Deed | -- | First American Mortgage Sln | |
| Warranty Deed | -- | Security Title Services | |
| Corporate Deed | -- | None Available |
| Date | Status | Loan Amount | Loan Type |
|---|---|---|---|
| Open | $152,250 | New Conventional | |
| Previous Owner | $176,225 | New Conventional | |
| Previous Owner | $162,800 | New Conventional | |
| Previous Owner | $166,310 | FHA | |
| Previous Owner | $825,000 | Commercial |
| Date | Event | Price | Change | Sq Ft Price |
|---|---|---|---|---|
| 08/13/2024 08/13/24 | Rented | $2,195 | 0.0% | -- |
| 07/10/2024 07/10/24 | For Rent | $2,195 | +4.5% | -- |
| 08/15/2023 08/15/23 | Rented | $2,100 | -4.3% | -- |
| 08/14/2023 08/14/23 | Under Contract | -- | -- | -- |
| 06/07/2023 06/07/23 | For Rent | $2,195 | +10.0% | -- |
| 12/10/2022 12/10/22 | Rented | $1,995 | 0.0% | -- |
| 10/11/2022 10/11/22 | For Rent | $1,995 | +2.3% | -- |
| 10/01/2021 10/01/21 | Rented | $1,950 | 0.0% | -- |
| 09/23/2021 09/23/21 | Under Contract | -- | -- | -- |
| 08/16/2021 08/16/21 | Price Changed | $1,950 | +22.3% | $1 / Sq Ft |
| 08/13/2021 08/13/21 | For Rent | $1,595 | 0.0% | -- |
| 12/15/2019 12/15/19 | Rented | $1,595 | 0.0% | -- |
| 11/22/2019 11/22/19 | Under Contract | -- | -- | -- |
| 10/08/2019 10/08/19 | For Rent | $1,595 | +6.3% | -- |
| 10/22/2018 10/22/18 | Rented | $1,500 | -9.1% | -- |
| 10/15/2018 10/15/18 | Under Contract | -- | -- | -- |
| 09/13/2018 09/13/18 | Price Changed | $1,650 | -5.7% | $1 / Sq Ft |
| 07/16/2018 07/16/18 | For Rent | $1,750 | 0.0% | -- |
| 07/12/2018 07/12/18 | Sold | $203,000 | 0.0% | $84 / Sq Ft |
| 06/20/2018 06/20/18 | Price Changed | $203,000 | +2.0% | $84 / Sq Ft |
| 06/02/2018 06/02/18 | Pending | -- | -- | -- |
| 05/31/2018 05/31/18 | For Sale | $199,000 | +7.3% | $83 / Sq Ft |
| 04/04/2014 04/04/14 | Sold | $185,500 | -1.3% | $78 / Sq Ft |
| 03/12/2014 03/12/14 | Pending | -- | -- | -- |
| 03/03/2014 03/03/14 | For Sale | $187,900 | -- | $79 / Sq Ft |
| Year | Tax Paid | Tax Assessment Tax Assessment Total Assessment is a certain percentage of the fair market value that is determined by local assessors to be the total taxable value of land and additions on the property. | Land | Improvement |
|---|---|---|---|---|
| 2024 | $1,843 | $253,600 | $33,200 | $220,400 |
| 2023 | $1,800 | $249,700 | $33,200 | $216,500 |
| 2022 | $1,702 | $229,100 | $26,400 | $202,700 |
| 2021 | $1,597 | $205,700 | $26,700 | $179,000 |
| 2020 | $1,540 | $190,500 | $25,200 | $165,300 |
| 2019 | $1,433 | $175,500 | $25,200 | $150,300 |
| 2018 | $1,344 | $174,400 | $25,200 | $149,200 |
| 2017 | $1,297 | $170,600 | $25,200 | $145,400 |
| 2016 | $1,144 | $156,300 | $25,200 | $131,100 |
| 2014 | $1,073 | $158,000 | $25,100 | $132,900 |
| 2013 | $1,074 | $160,600 | $25,100 | $135,500 |
M
Seller's Agent in 2024
Michael Cain
RE/MAX
(812) 228-5488
1 in this area
7 Total Sales
Seller's Agent in 2018
Julie Bosma
ERA FIRST ADVANTAGE REALTY, INC
(812) 457-6968
96 in this area
294 Total Sales
Buyer's Agent in 2018
Janice Miller
ERA FIRST ADVANTAGE REALTY, INC
(812) 453-0779
230 in this area
797 Total Sales
C
Seller's Agent in 2014
CHRIS WILLIAMS
F.C. TUCKER EMGE
Source: Indiana Regional MLS
MLS Number: 201405691
APN: 87-12-29-304-018.000-019
Disclaimer: Certain information contained herein is derived from information provided by parties other than Homes.com. All information provided is deemed reliable, but is not guaranteed to be accurate and should be independently verified.
![]() IDX information is provided exclusively for personal, non-commercial use, and may not be used for any purpose other than to identify prospective properties consumers may be interested in purchasing. Information is deemed reliable but not guaranteed.
IDX information is provided exclusively for personal, non-commercial use, and may not be used for any purpose other than to identify prospective properties consumers may be interested in purchasing. Information is deemed reliable but not guaranteed.