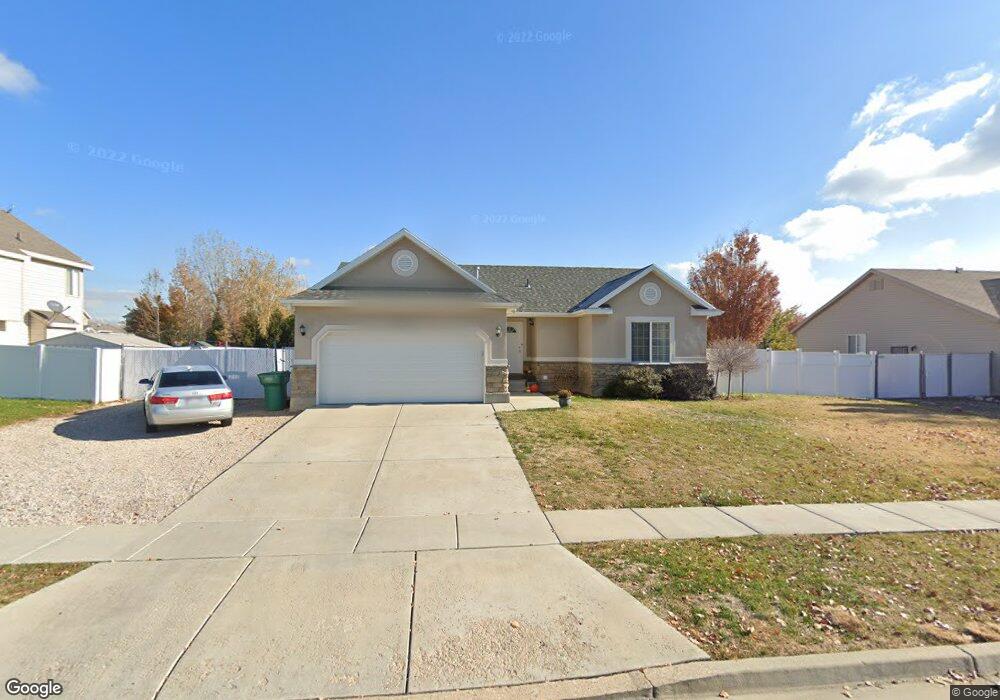
1074 N 3450 W Layton, UT 84041
Estimated Value: $537,085 - $565,000
6
Beds
3
Baths
2,605
Sq Ft
$210/Sq Ft
Est. Value
About This Home
This home is located at 1074 N 3450 W, Layton, UT 84041 and is currently estimated at $547,771, approximately $210 per square foot. 1074 N 3450 W is a home located in Davis County with nearby schools including Sand Springs Elementary School, Legacy Junior High School, and Layton High School.
Ownership History
Date
Name
Owned For
Owner Type
Purchase Details
Closed on
Apr 29, 2003
Sold by
Gmw Development Inc
Bought by
Cabral Jose and Cabral Marie L
Current Estimated Value
Home Financials for this Owner
Home Financials are based on the most recent Mortgage that was taken out on this home.
Original Mortgage
$161,436
Outstanding Balance
$69,199
Interest Rate
5.72%
Mortgage Type
FHA
Estimated Equity
$478,572
Create a Home Valuation Report for This Property
The Home Valuation Report is an in-depth analysis detailing your home's value as well as a comparison with similar homes in the area
Home Values in the Area
Average Home Value in this Area
Purchase History
| Date | Buyer | Sale Price | Title Company |
|---|---|---|---|
| Cabral Jose | -- | Bonneville Title Company Inc |
Source: Public Records
Mortgage History
| Date | Status | Borrower | Loan Amount |
|---|---|---|---|
| Open | Cabral Jose | $161,436 | |
| Closed | Cabral Jose | $3,000 |
Source: Public Records
Tax History Compared to Growth
Tax History
| Year | Tax Paid | Tax Assessment Tax Assessment Total Assessment is a certain percentage of the fair market value that is determined by local assessors to be the total taxable value of land and additions on the property. | Land | Improvement |
|---|---|---|---|---|
| 2025 | $2,502 | $275,550 | $121,552 | $153,998 |
| 2024 | $2,502 | $264,550 | $132,167 | $132,383 |
| 2023 | $2,414 | $450,000 | $135,408 | $314,592 |
| 2022 | $2,630 | $266,200 | $81,564 | $184,636 |
| 2021 | $2,385 | $360,000 | $122,349 | $237,651 |
| 2020 | $2,265 | $328,000 | $103,755 | $224,245 |
| 2019 | $2,221 | $315,000 | $104,513 | $210,487 |
| 2018 | $2,016 | $287,000 | $91,880 | $195,120 |
| 2016 | $1,702 | $125,015 | $37,090 | $87,925 |
| 2015 | $1,674 | $116,710 | $37,090 | $79,620 |
| 2014 | $1,689 | $120,409 | $37,090 | $83,319 |
| 2013 | -- | $106,647 | $28,952 | $77,695 |
Source: Public Records
Map
Nearby Homes