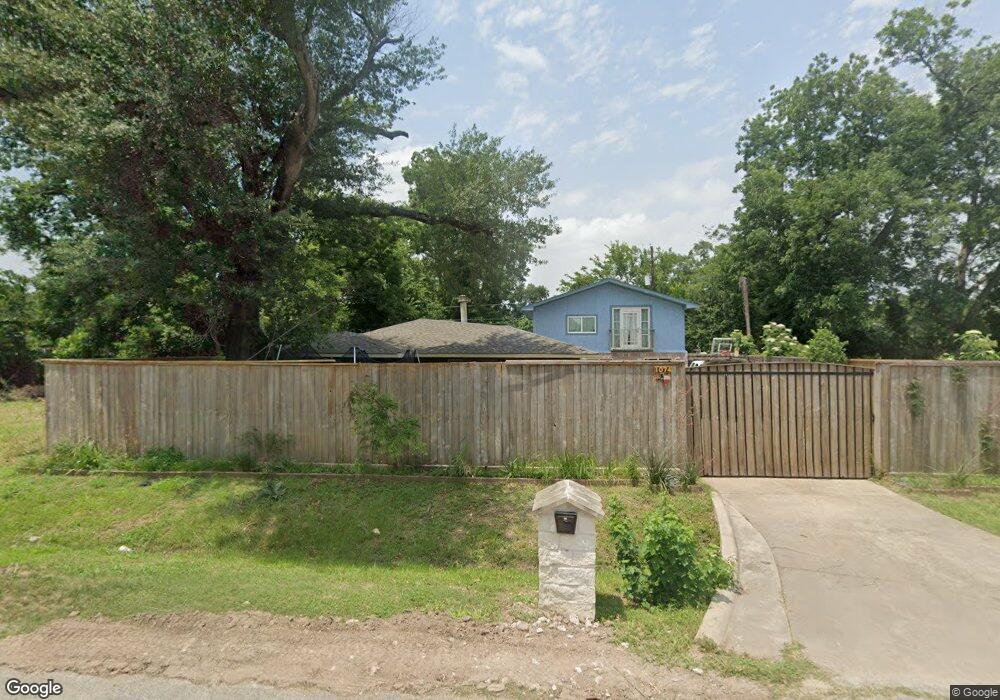
1074 Saint Clair St Houston, TX 77088
Acres Homes NeighborhoodEstimated Value: $151,000 - $237,000
5
Beds
2
Baths
2,756
Sq Ft
$77/Sq Ft
Est. Value
About This Home
This home is located at 1074 Saint Clair St, Houston, TX 77088 and is currently estimated at $211,961, approximately $76 per square foot. 1074 Saint Clair St is a home located in Harris County with nearby schools including Osborne Elementary School, Williams Middle, and Booker T Washington Sr High.
Ownership History
Date
Name
Owned For
Owner Type
Purchase Details
Closed on
Feb 22, 2023
Sold by
Olalde Fermin
Bought by
Gallegos Guzman Gregorio and Gonzalez Olalde Elisa
Current Estimated Value
Purchase Details
Closed on
Apr 21, 2016
Sold by
The Bank Of New York Mellon
Bought by
Olalde Fermin
Purchase Details
Closed on
Jul 13, 2015
Sold by
Alexander Ossie
Bought by
The Bank Of New York Mellon
Purchase Details
Closed on
Oct 21, 2008
Sold by
Dixon Ossie Lee and Alexander Ossie
Bought by
Alexander Ossie
Home Financials for this Owner
Home Financials are based on the most recent Mortgage that was taken out on this home.
Original Mortgage
$210,000
Interest Rate
3.49%
Mortgage Type
Reverse Mortgage Home Equity Conversion Mortgage
Purchase Details
Closed on
Nov 3, 1995
Sold by
Alexander Willie
Bought by
Alexander Ocie Lee
Create a Home Valuation Report for This Property
The Home Valuation Report is an in-depth analysis detailing your home's value as well as a comparison with similar homes in the area
Home Values in the Area
Average Home Value in this Area
Purchase History
| Date | Buyer | Sale Price | Title Company |
|---|---|---|---|
| Gallegos Guzman Gregorio | -- | -- | |
| Olalde Fermin | $55,000 | Veritas Title Partners | |
| The Bank Of New York Mellon | $90,000 | Attorney | |
| Alexander Ossie | -- | Sendera Title | |
| Alexander Ocie Lee | -- | -- |
Source: Public Records
Mortgage History
| Date | Status | Borrower | Loan Amount |
|---|---|---|---|
| Previous Owner | Alexander Ossie | $210,000 |
Source: Public Records
Tax History Compared to Growth
Tax History
| Year | Tax Paid | Tax Assessment Tax Assessment Total Assessment is a certain percentage of the fair market value that is determined by local assessors to be the total taxable value of land and additions on the property. | Land | Improvement |
|---|---|---|---|---|
| 2025 | $3,405 | $170,550 | $75,932 | $94,618 |
| 2024 | $3,405 | $162,736 | $75,932 | $86,804 |
| 2023 | $3,405 | $162,736 | $75,932 | $86,804 |
| 2022 | $3,473 | $157,736 | $59,264 | $98,472 |
| 2021 | $3,146 | $134,973 | $38,892 | $96,081 |
| 2020 | $3,046 | $125,769 | $33,336 | $92,433 |
| 2019 | $3,089 | $122,065 | $29,632 | $92,433 |
| 2018 | $2,687 | $106,176 | $17,136 | $89,040 |
| 2017 | $2,412 | $95,379 | $11,424 | $83,955 |
| 2016 | $2,412 | $95,379 | $11,424 | $83,955 |
| 2015 | -- | $88,302 | $11,424 | $76,878 |
| 2014 | -- | $88,302 | $11,424 | $76,878 |
Source: Public Records
Map
Nearby Homes
- 1093 Junell St
- 0 St Clair Unit 40573378
- 1053 Marjorie St
- 7805 Wheatley St
- 1052 Marjorie St
- 7217 Wheatley St
- 1050 Marjorie St
- 1034 Marjorie St
- 1038 Wall St
- 1037 Wall St
- 0 Prairie View Dr
- 943 Wall St
- 869 Wall St
- 959 Ringold St
- 8609 Wheatley St
- 1030 Reverend b j Lewis Dr
- 931 Lucky St
- 957 Ringold St
- 955 Ringold St
- 1061 South Ln
- 0A St Clair St
- 0B St Claire St
- 1078 Saint Clair St
- 1066 Saint Clair St
- 1081 Junell St
- 1071 Saint Clair St
- 1075 Junell St
- 1069 Saint Clair St
- 1087 Junell St
- 1073 Saint Clair St
- 1075 Saint Clair St
- 1062 Saint Clair St
- 1071 St Clair St
- 1077 Saint Clair St
- 1067 Saint Clair St
- 1065 Saint Clair St
- 1086 Saint Clair St
- 1058 Saint Clair St
- 1063 Saint Clair St
- 1095 Junell St