1074 Serenity Ridge Dr Unit 11 Wayland, MI 49348
Estimated Value: $346,221 - $350,000
2
Beds
2
Baths
1,200
Sq Ft
$290/Sq Ft
Est. Value
About This Home
This home is located at 1074 Serenity Ridge Dr Unit 11, Wayland, MI 49348 and is currently estimated at $348,305, approximately $290 per square foot. 1074 Serenity Ridge Dr Unit 11 is a home located in Allegan County with nearby schools including Wayland High School, St. Therese Catholic School, and Moline Christian School.
Ownership History
Date
Name
Owned For
Owner Type
Purchase Details
Closed on
Feb 5, 2010
Sold by
Tristar Excavating & Construction Inc
Bought by
Vanhouten Randy
Current Estimated Value
Home Financials for this Owner
Home Financials are based on the most recent Mortgage that was taken out on this home.
Original Mortgage
$111,900
Outstanding Balance
$74,686
Interest Rate
5.2%
Mortgage Type
New Conventional
Estimated Equity
$273,619
Purchase Details
Closed on
Oct 26, 2009
Sold by
Coastal Real Estate Holdings Llc
Bought by
Tristar Excavating & Construction Inc
Purchase Details
Closed on
Aug 26, 2009
Sold by
Chandler Holdings Llc
Bought by
Macatawa Bank
Create a Home Valuation Report for This Property
The Home Valuation Report is an in-depth analysis detailing your home's value as well as a comparison with similar homes in the area
Home Values in the Area
Average Home Value in this Area
Purchase History
| Date | Buyer | Sale Price | Title Company |
|---|---|---|---|
| Vanhouten Randy | $139,900 | River Valley Title | |
| Tristar Excavating & Construction Inc | -- | River Valley Title | |
| Macatawa Bank | -- | None Available |
Source: Public Records
Mortgage History
| Date | Status | Borrower | Loan Amount |
|---|---|---|---|
| Open | Vanhouten Randy | $111,900 |
Source: Public Records
Tax History Compared to Growth
Tax History
| Year | Tax Paid | Tax Assessment Tax Assessment Total Assessment is a certain percentage of the fair market value that is determined by local assessors to be the total taxable value of land and additions on the property. | Land | Improvement |
|---|---|---|---|---|
| 2025 | $2,689 | $137,800 | $21,800 | $116,000 |
| 2024 | $2,445 | $130,500 | $16,800 | $113,700 |
| 2023 | $2,445 | $119,000 | $16,800 | $102,200 |
| 2022 | $2,445 | $107,000 | $12,500 | $94,500 |
| 2021 | $2,282 | $99,500 | $12,500 | $87,000 |
| 2020 | $2,257 | $94,700 | $12,500 | $82,200 |
| 2019 | $2,191 | $86,900 | $12,500 | $74,400 |
| 2018 | $2,111 | $86,400 | $12,500 | $73,900 |
| 2017 | $0 | $84,900 | $15,000 | $69,900 |
| 2016 | $0 | $76,600 | $15,000 | $61,600 |
| 2015 | -- | $76,600 | $15,000 | $61,600 |
| 2014 | -- | $68,000 | $13,800 | $54,200 |
| 2013 | $411 | $66,400 | $13,800 | $52,600 |
Source: Public Records
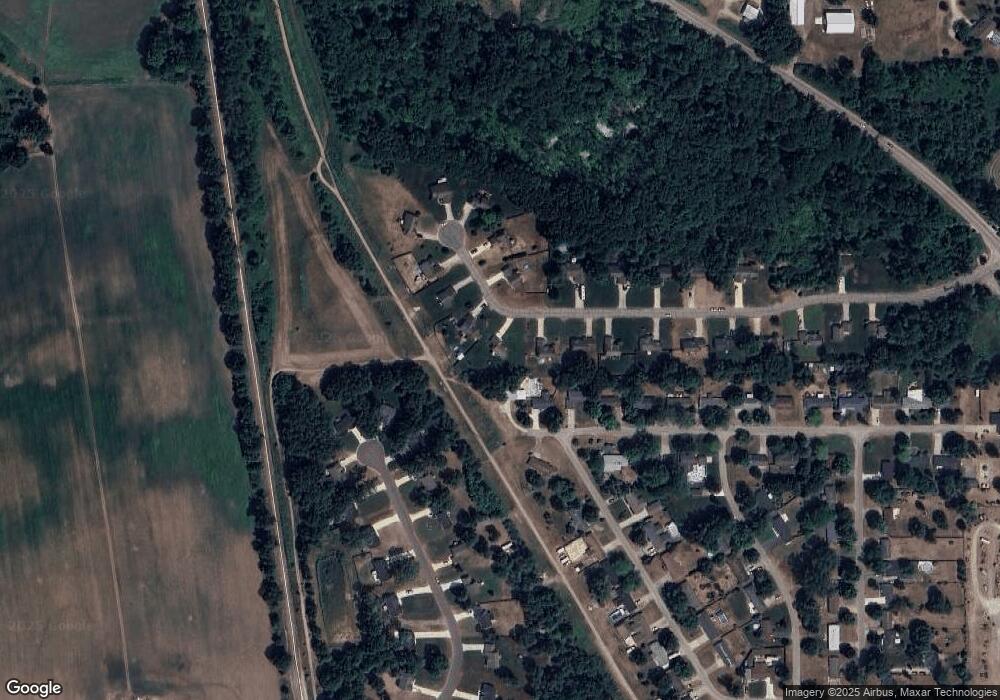
Map
Nearby Homes
- 3610 Garden St
- 3770 Division Ave S
- 545 N Main St
- 3570 Windsor Woods Dr
- 1143 Regina Trail
- 3685 Calkins Ct
- 219 Alpine St
- 4674 12th St
- 319 Alpine St
- 212 E Superior St
- 146 Hanlon Ct
- 110 E Sycamore St
- 621 S Main St
- 401 Anderson Dr
- 3897 Division St
- 330 Lotz Ct
- 835 Wild Flower Ct
- 3282 Stonehill Ct
- 3296 Stonehill Ct
- 3214 7th St
- 1078 Serenity Ridge Dr Unit 12
- 1070 Serenity Ridge Dr Unit 10
- 1069 Aster St
- 1082 Serenity Ridge Dr
- 1079 Serenity Ridge Dr
- 1066 Serenity Ridge Dr Unit 9
- 1067 Aster St
- 3645 Urban Depot Ct
- 1067 Serenity Ridge Dr
- 1086 Serenity Ridge Dr
- 1083 Serenity Ridge Dr Unit 18
- 1074 Aster St
- 1062 Serenity Ridge Dr Unit 8
- 1090 Serenity Ridge Dr Unit 15
- 1085 Serenity Ridge Dr Unit 17
- 1063 Serenity Ridge Dr Unit 21
- 1059 Aster St
- 1058 Serenity Ridge Dr Unit 7
- 3637 Urban Depot Ct
- 1058 Aster St