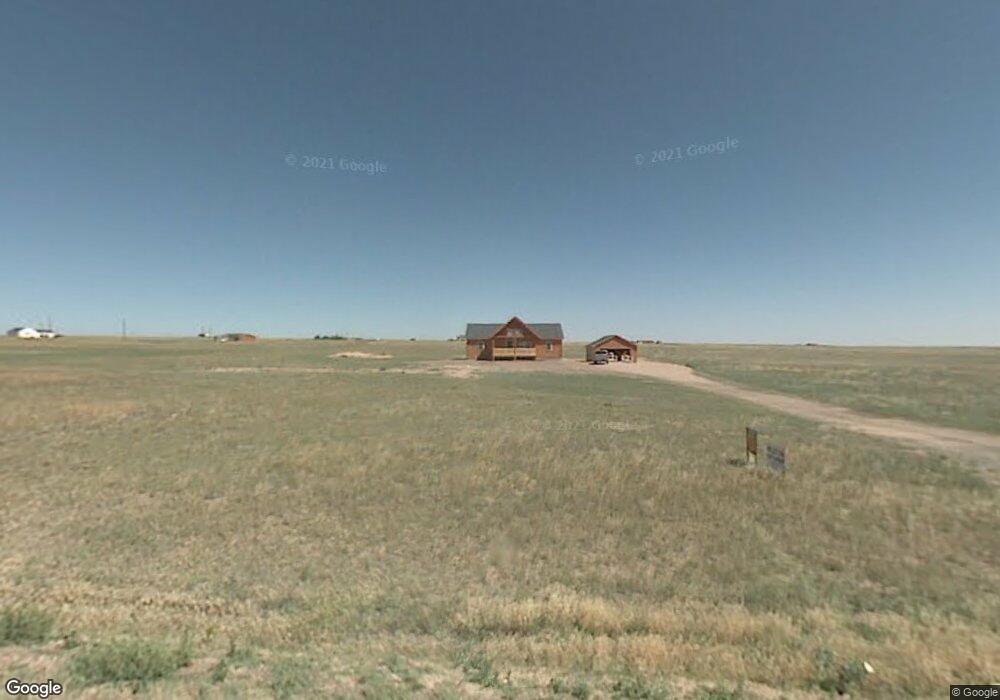
1074 W Plains Rd Cheyenne, WY 82009
Estimated Value: $370,000 - $459,000
--
Bed
--
Bath
1,232
Sq Ft
$341/Sq Ft
Est. Value
About This Home
This home is located at 1074 W Plains Rd, Cheyenne, WY 82009 and is currently estimated at $419,628, approximately $340 per square foot. 1074 W Plains Rd is a home located in Laramie County with nearby schools including Prairie Wind Elementary School, McCormick Junior High School, and Central High School.
Ownership History
Date
Name
Owned For
Owner Type
Purchase Details
Closed on
Oct 3, 2023
Sold by
Burnett James and Bartholomew Janet
Bought by
Burnett James and Bartholomew Janet
Current Estimated Value
Purchase Details
Closed on
Nov 25, 2008
Sold by
Weston Industries Inc
Bought by
Burnett James G and Bartholomew Janet J
Home Financials for this Owner
Home Financials are based on the most recent Mortgage that was taken out on this home.
Original Mortgage
$47,000
Interest Rate
6.5%
Mortgage Type
Purchase Money Mortgage
Purchase Details
Closed on
Mar 2, 2006
Sold by
Good Frank and Good Susan
Bought by
Trimpl William W
Purchase Details
Closed on
Nov 15, 2005
Sold by
Whites William D and Whites Robyn K
Bought by
Good Frank and Good Susan
Purchase Details
Closed on
Aug 4, 1998
Sold by
Scr Inc
Bought by
Whites William D and Whites Robyn K
Create a Home Valuation Report for This Property
The Home Valuation Report is an in-depth analysis detailing your home's value as well as a comparison with similar homes in the area
Home Values in the Area
Average Home Value in this Area
Purchase History
| Date | Buyer | Sale Price | Title Company |
|---|---|---|---|
| Burnett James | -- | None Listed On Document | |
| Burnett James G | -- | None Available | |
| Weston Industries Inc | -- | None Available | |
| Trimpl William W | -- | None Available | |
| Good Frank | -- | -- | |
| Whites William D | -- | -- |
Source: Public Records
Mortgage History
| Date | Status | Borrower | Loan Amount |
|---|---|---|---|
| Previous Owner | Burnett James G | $47,000 |
Source: Public Records
Tax History Compared to Growth
Tax History
| Year | Tax Paid | Tax Assessment Tax Assessment Total Assessment is a certain percentage of the fair market value that is determined by local assessors to be the total taxable value of land and additions on the property. | Land | Improvement |
|---|---|---|---|---|
| 2025 | $1,666 | $24,281 | $5,387 | $18,894 |
| 2024 | $1,666 | $30,784 | $7,182 | $23,602 |
| 2023 | $1,816 | $33,644 | $7,182 | $26,462 |
| 2022 | $1,414 | $27,049 | $5,886 | $21,163 |
| 2021 | $1,339 | $25,884 | $3,999 | $21,885 |
| 2020 | $1,095 | $22,311 | $2,755 | $19,556 |
| 2019 | $1,068 | $21,890 | $2,623 | $19,267 |
| 2018 | $1,060 | $21,930 | $2,623 | $19,307 |
| 2017 | $931 | $19,853 | $2,322 | $17,531 |
| 2016 | $903 | $19,432 | $2,262 | $17,170 |
| 2015 | $964 | $20,332 | $2,262 | $18,070 |
| 2014 | $941 | $19,901 | $2,275 | $17,626 |
Source: Public Records
Map
Nearby Homes
- 1069 W Plains Rd
- 1047 W Plains Rd
- 1796 Spring Creek Rd
- 1709 Shadow Valley Rd
- 1806 Mountain Shadow Ln S
- TBD Road 112
- 1889 Road 109
- 879 S Table Mtn Loop
- 1483 Gilchrist Rd
- 1420 Scenic Ridge Dr
- 1433 Scenic Ridge Dr
- Tract 25 Scenic Ridge Dr
- 1472 Scenic Ridge Dr
- 1526 Fox Chase Rd
- 759 Crow Creek Rd
- 1207 Road 113
- Tract 29 Latigo Loop
- Tract 63 Fire Rock Dr
- Tract 66 Fire Rock Dr
- 1536 Fire Rock Dr
- 1080 W Plains Rd
- 1066 W Plains Rd
- 1079 W Plains Rd
- TBD W Plains Rd
- Tr40 W Plains Rd
- Tr39 W Plains Rd
- 1768 E Mule Trail
- 1085 W Plains Rd
- 1061 W Plains Rd
- 1069 Prairie View Rd
- 1077 Prairie View Rd
- Tract 72 E Mule Trail
- Tract 10 E Mule Trail
- Tr 45 E Mule Trail
- 1057 W Plains Rd
- 1776 E Mule Trail
- 1767 E Mule Trail
- 1748 E Mule Trail
- 1755 E Mule Trail
- 1066 Blue Mountain Rd