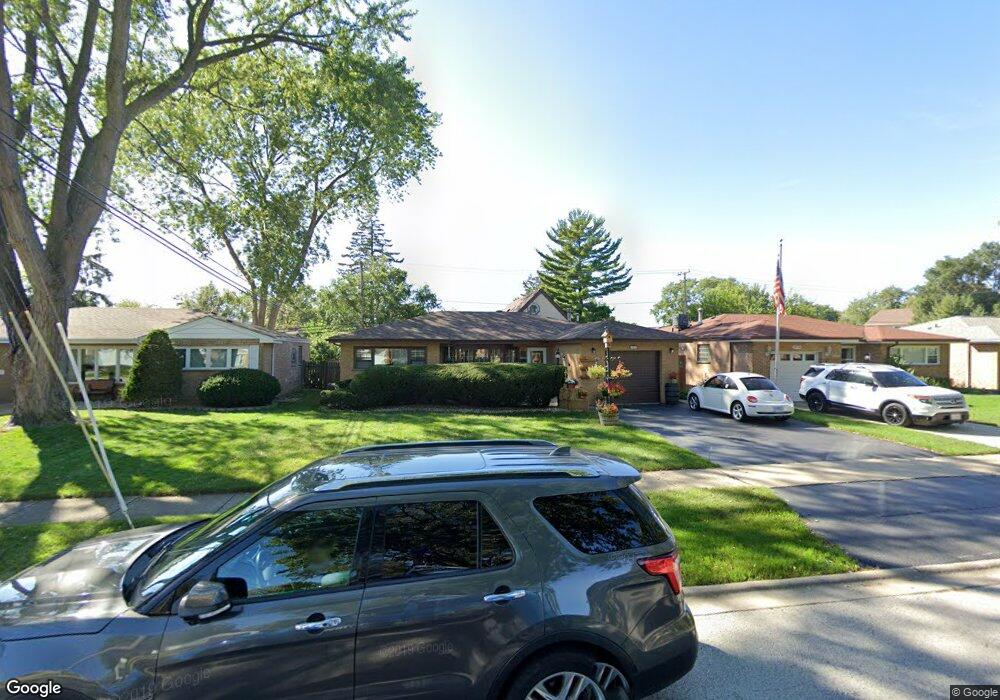
10740 S Keeler Ave Oak Lawn, IL 60453
Estimated Value: $314,000 - $351,000
3
Beds
2
Baths
1,552
Sq Ft
$218/Sq Ft
Est. Value
About This Home
This home is located at 10740 S Keeler Ave, Oak Lawn, IL 60453 and is currently estimated at $338,391, approximately $218 per square foot. 10740 S Keeler Ave is a home located in Cook County with nearby schools including Lawn Manor School, Meadow Lane School, and Hamlin Upper Grade Center.
Ownership History
Date
Name
Owned For
Owner Type
Purchase Details
Closed on
Mar 5, 2004
Sold by
Gordon Chris and Gordon Marni
Bought by
Gordon Chris and Gordon Marni
Current Estimated Value
Home Financials for this Owner
Home Financials are based on the most recent Mortgage that was taken out on this home.
Original Mortgage
$41,000
Outstanding Balance
$9,807
Interest Rate
5.77%
Mortgage Type
Credit Line Revolving
Estimated Equity
$328,584
Purchase Details
Closed on
Jul 8, 2002
Sold by
Gordon Chris
Bought by
Gordon Chris and Folkerts Marni
Home Financials for this Owner
Home Financials are based on the most recent Mortgage that was taken out on this home.
Original Mortgage
$159,446
Outstanding Balance
$67,976
Interest Rate
6.79%
Estimated Equity
$270,415
Purchase Details
Closed on
Jul 21, 2001
Sold by
Mitchell Christina M
Bought by
Gordon Chris
Home Financials for this Owner
Home Financials are based on the most recent Mortgage that was taken out on this home.
Original Mortgage
$147,150
Interest Rate
11.37%
Create a Home Valuation Report for This Property
The Home Valuation Report is an in-depth analysis detailing your home's value as well as a comparison with similar homes in the area
Home Values in the Area
Average Home Value in this Area
Purchase History
| Date | Buyer | Sale Price | Title Company |
|---|---|---|---|
| Gordon Chris | -- | K & M Title Co | |
| Gordon Chris | -- | First American Title | |
| Gordon Chris | $155,000 | -- |
Source: Public Records
Mortgage History
| Date | Status | Borrower | Loan Amount |
|---|---|---|---|
| Open | Gordon Chris | $41,000 | |
| Open | Gordon Chris | $159,446 | |
| Closed | Gordon Chris | $147,150 |
Source: Public Records
Tax History Compared to Growth
Tax History
| Year | Tax Paid | Tax Assessment Tax Assessment Total Assessment is a certain percentage of the fair market value that is determined by local assessors to be the total taxable value of land and additions on the property. | Land | Improvement |
|---|---|---|---|---|
| 2024 | $6,996 | $26,001 | $4,813 | $21,188 |
| 2023 | $5,168 | $26,001 | $4,813 | $21,188 |
| 2022 | $5,168 | $17,222 | $4,125 | $13,097 |
| 2021 | $4,992 | $17,222 | $4,125 | $13,097 |
| 2020 | $5,066 | $17,222 | $4,125 | $13,097 |
| 2019 | $5,871 | $19,483 | $3,781 | $15,702 |
| 2018 | $5,662 | $19,483 | $3,781 | $15,702 |
| 2017 | $5,747 | $19,483 | $3,781 | $15,702 |
| 2016 | $5,359 | $16,518 | $3,093 | $13,425 |
| 2015 | $5,208 | $16,518 | $3,093 | $13,425 |
| 2014 | $5,152 | $16,518 | $3,093 | $13,425 |
| 2013 | $5,629 | $19,410 | $3,093 | $16,317 |
Source: Public Records
Map
Nearby Homes
- 10823 S Keeler Ave
- 10728 S Pulaski Rd
- 4000 W 107th St
- 4328 W 109th St
- 4343 W 109th St
- 10800 S Kostner Ave
- 3857 W 107th Place
- 10713 S Kenneth Ave
- 10509 Kedvale Ave
- 4325 Adeline Dr
- 3818 W 107th St
- 3812 W 109th Place
- 3836 W 110th Place
- 10448 S Pulaski Rd
- 10418 S Pulaski Rd Unit 204C
- 10420 S Kildare Ave
- 3838 W 111th St Unit 209
- 3955 W 104th St Unit 2B
- 10606 S Ridgeway Ave
- 3909 W 104th St
- 10736 S Keeler Ave
- 10744 S Keeler Ave
- 10748 S Keeler Ave
- 10807 S Tripp Ave
- 10809 S Tripp Ave
- 10726 S Keeler Ave
- 10804 S Keeler Ave
- 10721 Tripp Ct
- 10739 S Keeler Ave
- 10743 S Keeler Ave
- 10813 S Tripp Ave
- 10747 S Keeler Ave
- 10722 S Keeler Ave
- 10808 S Keeler Ave
- 10719 Tripp Ct
- 10805 S Tripp Ave
- 10803 S Keeler Ave
- 10815 S Tripp Ave
- 10723 Tripp Ct