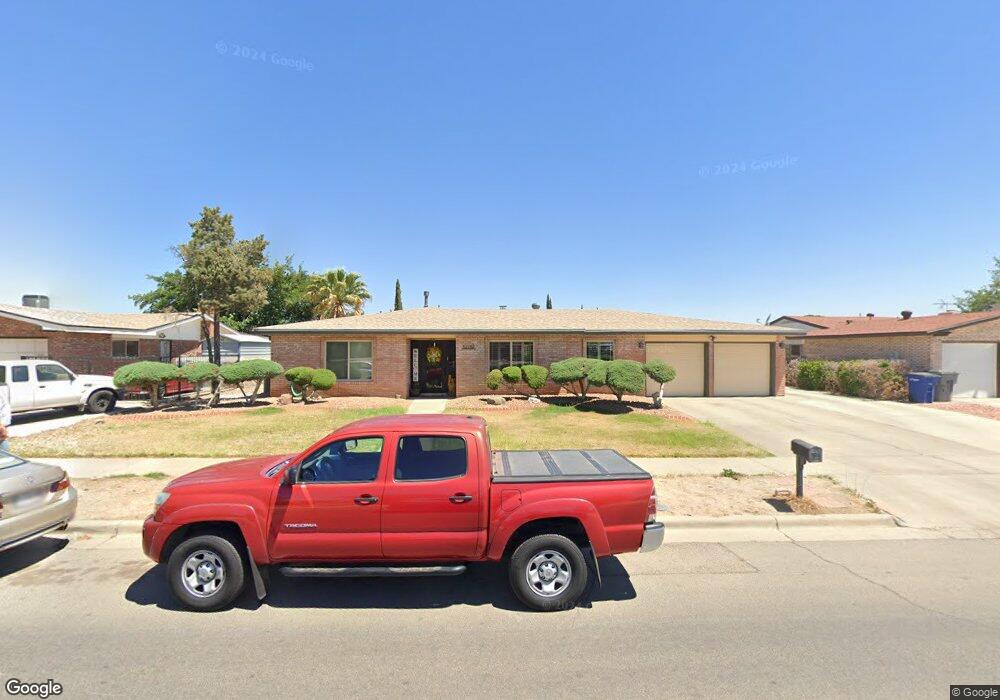
10741 Janway Dr El Paso, TX 79935
Vista Del Sol NeighborhoodEstimated Value: $282,294 - $352,000
4
Beds
2
Baths
2,179
Sq Ft
$143/Sq Ft
Est. Value
About This Home
This home is located at 10741 Janway Dr, El Paso, TX 79935 and is currently estimated at $310,574, approximately $142 per square foot. 10741 Janway Dr is a home located in El Paso County with nearby schools including Vista Hills Elementary School, J M Hanks High School, and St. Raphael School.
Ownership History
Date
Name
Owned For
Owner Type
Purchase Details
Closed on
May 20, 2011
Sold by
Martinez Susana and Martinez Susana Sanchez
Bought by
Moore Jesus Sergio and Moore Veronica M
Current Estimated Value
Home Financials for this Owner
Home Financials are based on the most recent Mortgage that was taken out on this home.
Original Mortgage
$170,445
Outstanding Balance
$118,832
Interest Rate
4.95%
Mortgage Type
VA
Estimated Equity
$191,742
Purchase Details
Closed on
Apr 25, 2007
Sold by
Martinez Manuel C
Bought by
Martinez Susana Sanchez
Purchase Details
Closed on
Jun 27, 1997
Sold by
Gonzalez Martin H and Gonzalez Carmen R
Bought by
Martinez Manuel C and Martinez Susana
Home Financials for this Owner
Home Financials are based on the most recent Mortgage that was taken out on this home.
Original Mortgage
$101,650
Interest Rate
7.93%
Purchase Details
Closed on
Jun 23, 1994
Sold by
Schydlower Manuel and Schydlower Elizabeth A
Bought by
Gonzalez Martin H
Create a Home Valuation Report for This Property
The Home Valuation Report is an in-depth analysis detailing your home's value as well as a comparison with similar homes in the area
Home Values in the Area
Average Home Value in this Area
Purchase History
| Date | Buyer | Sale Price | Title Company |
|---|---|---|---|
| Moore Jesus Sergio | -- | None Available | |
| Martinez Susana Sanchez | -- | None Available | |
| Martinez Manuel C | -- | -- | |
| Gonzalez Martin H | -- | -- |
Source: Public Records
Mortgage History
| Date | Status | Borrower | Loan Amount |
|---|---|---|---|
| Open | Moore Jesus Sergio | $170,445 | |
| Previous Owner | Martinez Manuel C | $101,650 |
Source: Public Records
Tax History Compared to Growth
Tax History
| Year | Tax Paid | Tax Assessment Tax Assessment Total Assessment is a certain percentage of the fair market value that is determined by local assessors to be the total taxable value of land and additions on the property. | Land | Improvement |
|---|---|---|---|---|
| 2025 | $4,702 | $240,000 | $44,458 | $195,542 |
| 2024 | $4,702 | $239,690 | $29,750 | $209,940 |
| 2023 | $4,654 | $227,967 | $0 | $0 |
| 2022 | $6,436 | $207,243 | $0 | $0 |
| 2021 | $6,124 | $188,403 | $29,750 | $158,653 |
| 2020 | $5,782 | $183,045 | $29,750 | $153,295 |
| 2018 | $5,525 | $177,678 | $29,750 | $147,928 |
| 2017 | $5,111 | $167,221 | $29,750 | $137,471 |
| 2016 | $5,111 | $167,221 | $29,750 | $137,471 |
| 2015 | $4,307 | $167,221 | $29,750 | $137,471 |
| 2014 | $4,307 | $176,460 | $29,750 | $146,710 |
Source: Public Records
Map
Nearby Homes
- 2109 Febrero Dr
- 2105 Pacheco Dr
- 2000 Solano Dr
- 1955 Trawood Dr Unit 12
- 1909 Crow Dr
- 2153 Trawood Dr
- 2201 Trawood Dr
- 1730 Bara Dr
- 2224 Escarpa Dr
- 1844 Jack Nicklaus Dr Unit 1846
- 1644 Lomaland Dr Unit 169
- 2313 Frank Beard Dr
- 1649 Lomaland Dr
- 10313 Byway Dr
- 10512 Album Ave
- 10309 Woodruff Ct
- 10304 Woodruff Ct
- 10233 Byway Dr
- 2705 Fierro Dr
- 2325 Ken Venturi Ln
- 10737 Janway Dr
- 10745 Janway Dr
- 1916 Octubre Dr
- 1920 Octubre Dr
- 1912 Octubre Dr
- 10740 Janway Dr
- 10733 Janway Dr
- 10749 Janway Dr
- 10736 Janway Dr
- 10744 Janway Dr
- 1908 Octubre Dr
- 1924 Octubre Dr
- 10732 Janway Dr
- 10748 Janway Dr
- 10729 Janway Dr
- 10753 Janway Dr
- 10713 Alta Loma Dr
- 1904 Octubre Dr
- 1917 Octubre Dr
- 1928 Octubre Dr