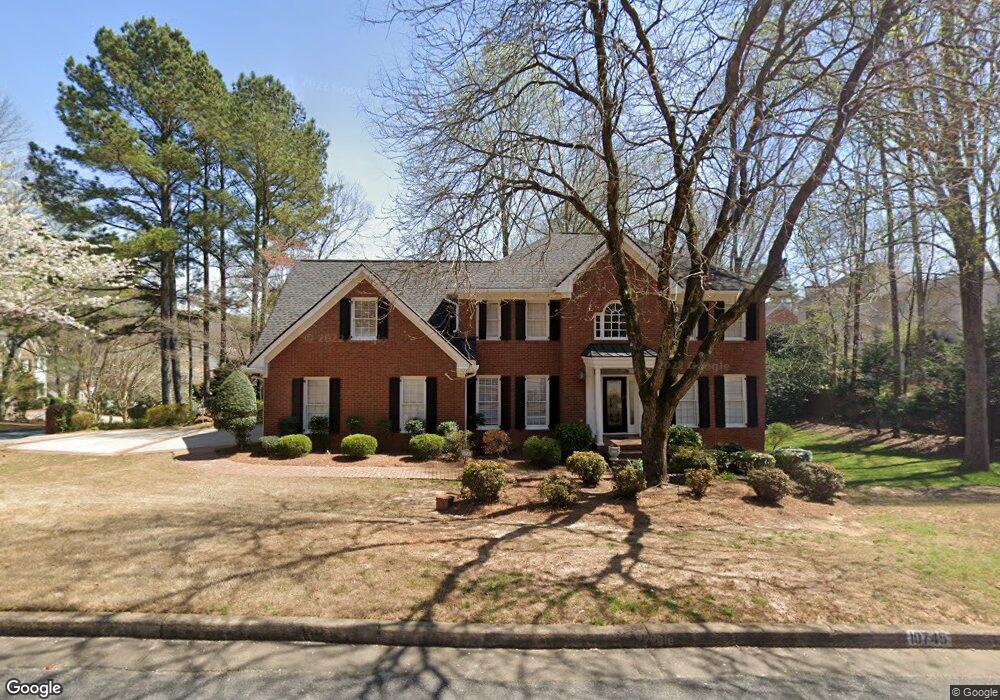
10745 Dunoon Dr Unit 1 Alpharetta, GA 30022
Estimated Value: $734,789 - $819,000
5
Beds
3
Baths
2,572
Sq Ft
$302/Sq Ft
Est. Value
About This Home
This home is located at 10745 Dunoon Dr Unit 1, Alpharetta, GA 30022 and is currently estimated at $777,197, approximately $302 per square foot. 10745 Dunoon Dr Unit 1 is a home located in Fulton County with nearby schools including Ocee Elementary School, Taylor Road Middle School, and Chattahoochee High School.
Ownership History
Date
Name
Owned For
Owner Type
Purchase Details
Closed on
Oct 25, 2011
Sold by
Blake Beverly V
Bought by
Blake David L
Current Estimated Value
Purchase Details
Closed on
Jul 24, 2003
Sold by
Wang Mike H
Bought by
Blake David L and Blake Beverly
Home Financials for this Owner
Home Financials are based on the most recent Mortgage that was taken out on this home.
Original Mortgage
$249,600
Interest Rate
5.42%
Mortgage Type
New Conventional
Purchase Details
Closed on
Jul 15, 1994
Sold by
Salhuana Jorge Norah
Bought by
Wang Mike H and Chen Jackie
Home Financials for this Owner
Home Financials are based on the most recent Mortgage that was taken out on this home.
Original Mortgage
$102,500
Interest Rate
8.37%
Create a Home Valuation Report for This Property
The Home Valuation Report is an in-depth analysis detailing your home's value as well as a comparison with similar homes in the area
Home Values in the Area
Average Home Value in this Area
Purchase History
| Date | Buyer | Sale Price | Title Company |
|---|---|---|---|
| Blake David L | -- | -- | |
| Blake David L | $312,000 | -- | |
| Wang Mike H | $202,500 | -- |
Source: Public Records
Mortgage History
| Date | Status | Borrower | Loan Amount |
|---|---|---|---|
| Previous Owner | Blake David L | $249,600 | |
| Previous Owner | Wang Mike H | $102,500 |
Source: Public Records
Tax History Compared to Growth
Tax History
| Year | Tax Paid | Tax Assessment Tax Assessment Total Assessment is a certain percentage of the fair market value that is determined by local assessors to be the total taxable value of land and additions on the property. | Land | Improvement |
|---|---|---|---|---|
| 2025 | $625 | $289,120 | $86,920 | $202,200 |
| 2023 | $7,163 | $253,760 | $63,440 | $190,320 |
| 2022 | $3,694 | $191,160 | $43,080 | $148,080 |
| 2021 | $4,177 | $167,960 | $41,880 | $126,080 |
| 2020 | $4,202 | $165,960 | $41,400 | $124,560 |
| 2019 | $650 | $167,840 | $38,680 | $129,160 |
| 2018 | $4,040 | $163,880 | $37,760 | $126,120 |
| 2017 | $3,642 | $136,760 | $23,160 | $113,600 |
| 2016 | $3,626 | $136,760 | $23,160 | $113,600 |
| 2015 | $4,794 | $136,760 | $23,160 | $113,600 |
| 2014 | $3,789 | $123,600 | $25,800 | $97,800 |
Source: Public Records
Map
Nearby Homes
- 125 Sandridge Ct
- 10880 Windham Way
- 465 Kirkstall Trail
- 10530 Tuxford Dr
- 610 Varina Way
- 10845 Carrissa Trail
- 345 Kincardine Way Unit IIIA
- 710 Country Manor Way
- 285 Rolling Mist Ct
- 105 Kimball Bridge Cove
- 825 Highland Bend Cove
- 3962 Erin Dr
- 10515 Colony Glen Dr Unit 2
- 4465 Hawthorn Cir
- 4462 Hawthorn Cir
- 120 Thome Dr
- 235 Wood Shoals Ct
- 10700 Tuxford Dr
- 10735 Dunoon Dr
- 10730 Tuxford Dr Unit I
- 310 Rosalie Ct
- 10725 Tuxford Dr
- 10690 Tuxford Dr
- 10735 Tuxford Dr
- 320 Rosalie Ct
- 10715 Tuxford Dr
- 10740 Dunoon Dr
- 10740 Tuxford Dr
- 10745 Tuxford Dr
- 10730 Dunoon Dr
- 10680 Tuxford Dr
- 10705 Tuxford Dr Unit 5
- 330 Rosalie Ct
- 305 Rosalie Ct
- 10805 Windham Way
- 205 Bryn Athyn Ct
- 315 Rosalie Ct Unit 2