10745 Nebraska St Unit 3 Frankfort, IL 60423
North Frankfort NeighborhoodEstimated Value: $709,000 - $828,000
4
Beds
3
Baths
3,300
Sq Ft
$229/Sq Ft
Est. Value
About This Home
This home is located at 10745 Nebraska St Unit 3, Frankfort, IL 60423 and is currently estimated at $754,735, approximately $228 per square foot. 10745 Nebraska St Unit 3 is a home located in Will County with nearby schools including Grand Prairie Elementary School, Chelsea Intermediate School, and Hickory Creek Middle School.
Ownership History
Date
Name
Owned For
Owner Type
Purchase Details
Closed on
Jul 14, 2017
Sold by
Petak Robert and Petak Miranda
Bought by
Petak Robert J and Rj Petak Family Trust
Current Estimated Value
Purchase Details
Closed on
Feb 18, 2013
Sold by
Petak Robert and Petak Miranda
Bought by
Petak Robert and Petak Miranda
Purchase Details
Closed on
May 6, 2011
Sold by
Kwilose Jeffrey D and Kwilose Amy H
Bought by
Petak Robert
Home Financials for this Owner
Home Financials are based on the most recent Mortgage that was taken out on this home.
Original Mortgage
$300,000
Outstanding Balance
$197,299
Interest Rate
3.75%
Mortgage Type
New Conventional
Estimated Equity
$557,436
Purchase Details
Closed on
Apr 26, 2007
Sold by
Marquette Bank
Bought by
Kwilose Jeffrey D and Kwilose Amy H
Home Financials for this Owner
Home Financials are based on the most recent Mortgage that was taken out on this home.
Original Mortgage
$408,350
Interest Rate
6.12%
Mortgage Type
Purchase Money Mortgage
Create a Home Valuation Report for This Property
The Home Valuation Report is an in-depth analysis detailing your home's value as well as a comparison with similar homes in the area
Home Values in the Area
Average Home Value in this Area
Purchase History
| Date | Buyer | Sale Price | Title Company |
|---|---|---|---|
| Petak Robert J | -- | Chicago Title Insurance Co | |
| Petak Robert | -- | Chicago Title Insurance Comp | |
| Petak Robert | $375,000 | Citywide Title Corporation | |
| Kwilose Jeffrey D | $510,500 | Chicago Title Insurance Co |
Source: Public Records
Mortgage History
| Date | Status | Borrower | Loan Amount |
|---|---|---|---|
| Open | Petak Robert | $300,000 | |
| Previous Owner | Kwilose Jeffrey D | $408,350 |
Source: Public Records
Tax History Compared to Growth
Tax History
| Year | Tax Paid | Tax Assessment Tax Assessment Total Assessment is a certain percentage of the fair market value that is determined by local assessors to be the total taxable value of land and additions on the property. | Land | Improvement |
|---|---|---|---|---|
| 2024 | $14,690 | $213,412 | $32,887 | $180,525 |
| 2023 | $14,690 | $190,597 | $29,371 | $161,226 |
| 2022 | $12,526 | $173,601 | $26,752 | $146,849 |
| 2021 | $11,707 | $142,411 | $25,028 | $117,383 |
| 2020 | $11,419 | $138,398 | $24,323 | $114,075 |
| 2019 | $11,054 | $134,694 | $23,672 | $111,022 |
| 2018 | $10,860 | $130,821 | $22,991 | $107,830 |
| 2017 | $10,855 | $127,767 | $22,454 | $105,313 |
| 2016 | $10,603 | $123,387 | $21,684 | $101,703 |
| 2015 | $10,343 | $119,042 | $20,920 | $98,122 |
| 2014 | $10,343 | $118,215 | $20,775 | $97,440 |
| 2013 | $10,343 | $119,747 | $21,044 | $98,703 |
Source: Public Records
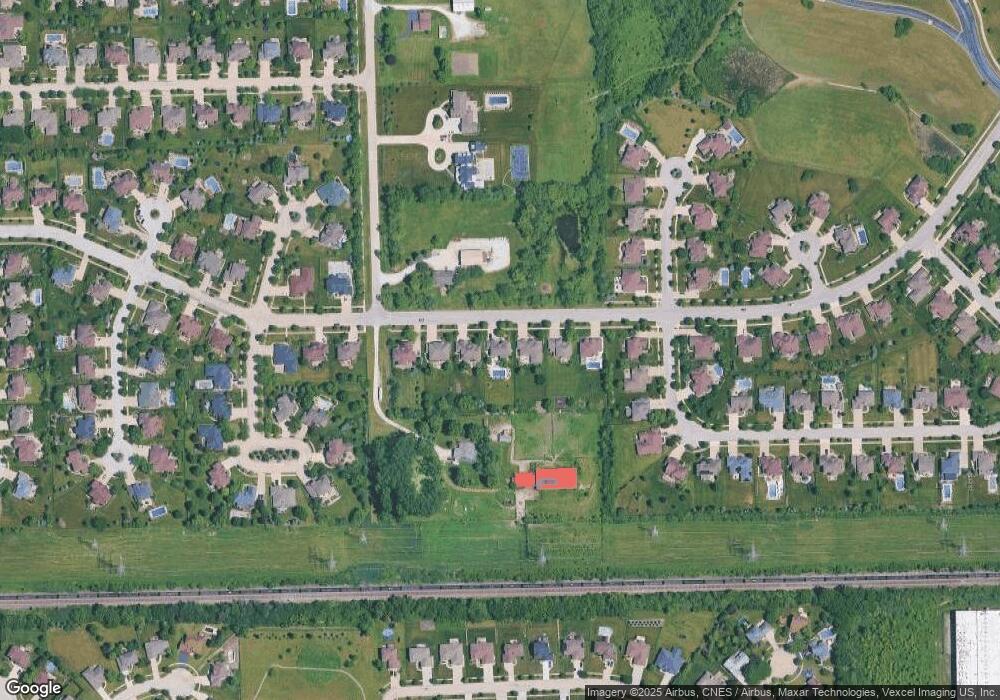
Map
Nearby Homes
- 10652 Lexington Ct
- 10785 Ashford Ave
- 10993 Pioneer Trail
- 10850 W Laraway Rd
- 21696 Cappel Ln
- 21629 Kent Ct
- 119 Pleasant Hill Ct
- 22151 Clove Dr
- 481 Pleasant Hill Rd
- 22125 Jasmine Dr
- 337 Sherlock St
- 613 Johnson Ave Unit 613
- 21409 Foxtail Dr
- 11453 Falls View Way
- 1018 S Butternut Cir
- 425 Cottonwood Rd
- 21647 S Owens Rd
- 143 Walnut St
- 21334 Sage Brush Ln
- 22727 S Butler Ln
- 10759 Nebraska St
- 10731 Nebraska St
- 10773 Nebraska St
- 10717 Nebraska St
- 10787 Nebraska St
- 10703 Nebraska St
- 21727 S 108th Ave
- 21821 S 108th Ave
- 10673 Shilling Rd
- 10679 Shilling Rd
- 10667 Shilling Rd
- 10816 Nebraska St
- 10661 Shilling Rd
- 21764 Shilling Ct
- 21863 Blue Bird Ln
- 21851 Blue Bird Ln
- 21752 Shilling Ct
- 10813 Nebraska St
- 10828 Nebraska St
- 21740 Shilling Ct