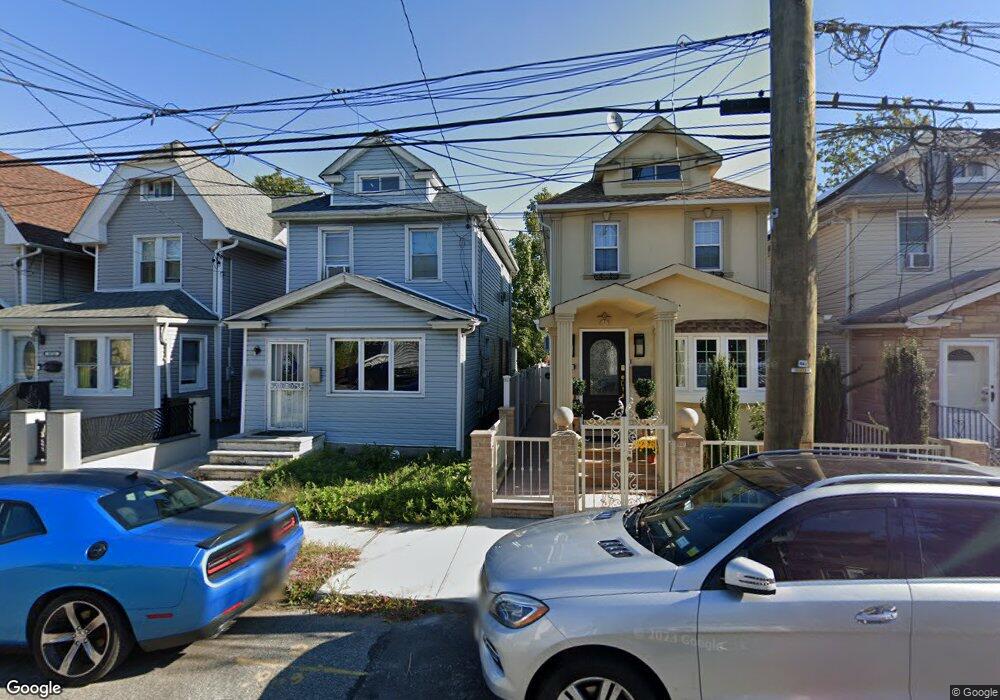
10747 164th St Jamaica, NY 11433
Jamaica NeighborhoodEstimated Value: $607,201 - $728,000
--
Bed
--
Bath
1,196
Sq Ft
$558/Sq Ft
Est. Value
About This Home
This home is located at 10747 164th St, Jamaica, NY 11433 and is currently estimated at $667,550, approximately $558 per square foot. 10747 164th St is a home located in Queens County with nearby schools including Junior High School 8 Richard S Grossley.
Ownership History
Date
Name
Owned For
Owner Type
Purchase Details
Closed on
Dec 2, 1999
Sold by
Progress Equities Inc
Bought by
Hooks Kala and Smith Lilian
Current Estimated Value
Home Financials for this Owner
Home Financials are based on the most recent Mortgage that was taken out on this home.
Original Mortgage
$147,751
Interest Rate
7.83%
Mortgage Type
FHA
Purchase Details
Closed on
Dec 4, 1998
Sold by
Hogar Inc
Bought by
Progress Equities Inc
Purchase Details
Closed on
Oct 14, 1998
Sold by
Hud
Bought by
Hogar Inc
Purchase Details
Closed on
Dec 5, 1994
Sold by
Midtown Development Corp
Bought by
Khan Rasheed and Khan Shabier
Home Financials for this Owner
Home Financials are based on the most recent Mortgage that was taken out on this home.
Original Mortgage
$113,350
Interest Rate
9.24%
Mortgage Type
FHA
Create a Home Valuation Report for This Property
The Home Valuation Report is an in-depth analysis detailing your home's value as well as a comparison with similar homes in the area
Home Values in the Area
Average Home Value in this Area
Purchase History
| Date | Buyer | Sale Price | Title Company |
|---|---|---|---|
| Hooks Kala | $149,000 | Commonwealth Land Title Ins | |
| Progress Equities Inc | $66,000 | Title Usa Insurance Corp | |
| Hogar Inc | $70,500 | -- | |
| Khan Rasheed | $113,500 | Ticor Title Guarantee Compan |
Source: Public Records
Mortgage History
| Date | Status | Borrower | Loan Amount |
|---|---|---|---|
| Previous Owner | Hooks Kala | $147,751 | |
| Previous Owner | Khan Rasheed | $113,350 |
Source: Public Records
Tax History Compared to Growth
Tax History
| Year | Tax Paid | Tax Assessment Tax Assessment Total Assessment is a certain percentage of the fair market value that is determined by local assessors to be the total taxable value of land and additions on the property. | Land | Improvement |
|---|---|---|---|---|
| 2025 | $2,888 | $16,663 | $4,276 | $12,387 |
| 2024 | $2,314 | $15,779 | $4,091 | $11,688 |
| 2023 | $2,888 | $15,779 | $3,934 | $11,845 |
| 2022 | $2,811 | $40,980 | $10,500 | $30,480 |
| 2021 | $2,786 | $36,540 | $10,500 | $26,040 |
| 2020 | $2,643 | $32,460 | $10,500 | $21,960 |
| 2019 | $2,458 | $27,900 | $10,500 | $17,400 |
| 2018 | $2,383 | $13,149 | $5,977 | $7,172 |
| 2017 | $2,337 | $12,934 | $7,118 | $5,816 |
| 2016 | $2,130 | $12,934 | $7,118 | $5,816 |
| 2015 | $1,252 | $11,572 | $7,434 | $4,138 |
| 2014 | $1,252 | $10,958 | $7,459 | $3,499 |
Source: Public Records
Map
Nearby Homes
- 107-06 165th St
- 107-30 Guy R Brewer Blvd Unit 18B
- 107-04 Guy R Brewer Blvd Unit 7A
- 107-29 Union Hall St
- 107-54 Merrick Blvd
- 10709 Union Hall St
- 106-49 Guy R Brewer Blvd
- 164-46 109th Ave
- 10812 Union Hall St
- 109-10 Guy R Brewer Blvd
- 108-25 160th St Unit 24A
- 16427 109th Dr
- 16731 109th Ave
- 109-15 Lot A Guy R Brewer Blvd
- 16737 109th Rd
- 11003 164th Place
- 110-04 164th St
- 110-03 Guy R Brewer Blvd Unit 40
- 10909 169th Place
- 109-15 169th Place
- 10745 164th St
- 10743 164th St
- 10745 164th St
- 107-41 164th St
- 10741 164th St
- 10749 164th St
- 10739 164th St
- 10753 164th St
- 10755 164th St
- 10735 164th St
- 10755 164th St
- 10746 164th Place
- 10748 164th Place
- 10742 164th Place
- 107-46 164th Place
- 10757 164th St
- 107-33 164th St
- 10733 164th St
- 16411 108th Ave
- 10738 164th Place