Estimated Value: $453,000 - $497,771
Studio
--
Bath
1,345
Sq Ft
$355/Sq Ft
Est. Value
About This Home
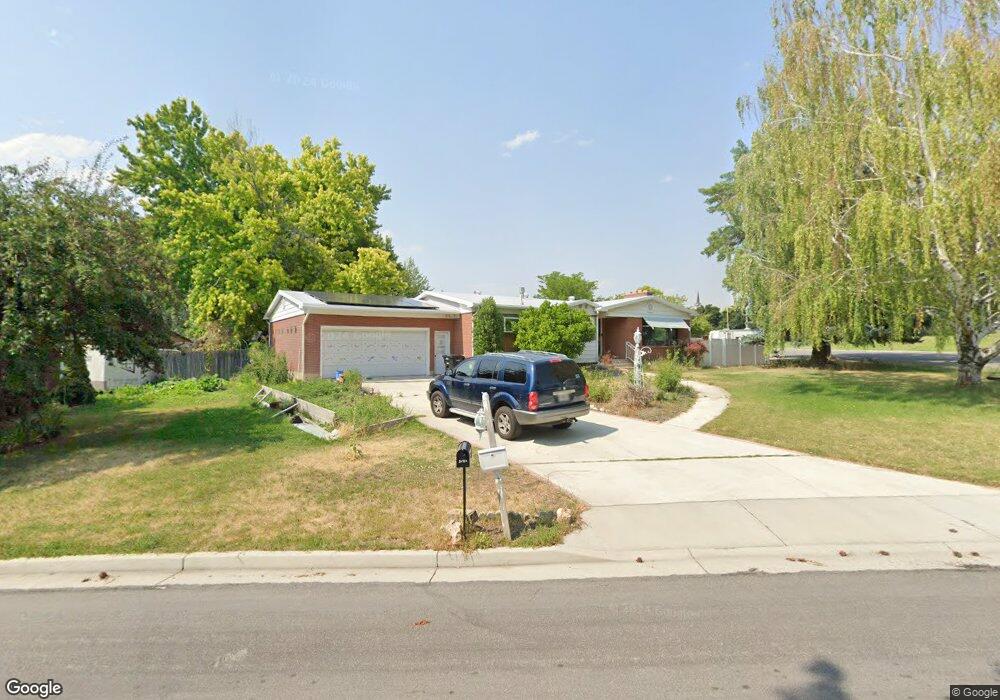
This home is located at 1075 E 2000 N, Logan, UT 84341 and is currently estimated at $477,193, approximately $354 per square foot. 1075 E 2000 N is a home with nearby schools including Greenville School, Cedar Ridge School, and North Cache Middle School.
Ownership History
Date
Name
Owned For
Owner Type
Purchase Details
Closed on
May 14, 2021
Sold by
Hansen Matthew and Hansen Paysha
Bought by
Hansen Paysha and Hansen Matthew P
Current Estimated Value
Home Financials for this Owner
Home Financials are based on the most recent Mortgage that was taken out on this home.
Original Mortgage
$210,900
Outstanding Balance
$190,721
Interest Rate
3.1%
Mortgage Type
New Conventional
Estimated Equity
$286,472
Purchase Details
Closed on
Feb 26, 2021
Sold by
Keller Everton Richard
Bought by
Richard K Everton K and Richard Sandra S
Home Financials for this Owner
Home Financials are based on the most recent Mortgage that was taken out on this home.
Original Mortgage
$225,000
Interest Rate
2.7%
Mortgage Type
Commercial
Purchase Details
Closed on
Oct 22, 2001
Sold by
Everton Richard K and Everton Sandra S
Bought by
Everton Richard K and Everton Sandra S
Purchase Details
Closed on
Apr 13, 2001
Sold by
Everton Richard K and Everton Sandra S
Bought by
Everton Richard K and Everton Sandra S
Create a Home Valuation Report for This Property
The Home Valuation Report is an in-depth analysis detailing your home's value as well as a comparison with similar homes in the area
Home Values in the Area
Average Home Value in this Area
Purchase History
| Date | Buyer | Sale Price | Title Company |
|---|---|---|---|
| Hansen Paysha | -- | Backman Title Services Ltd | |
| Richard K Everton K | -- | -- | |
| Hansen Matthew | -- | None Available | |
| Everton Richard K | -- | -- | |
| Everton Richard K | -- | -- |
Source: Public Records
Mortgage History
| Date | Status | Borrower | Loan Amount |
|---|---|---|---|
| Open | Hansen Paysha | $210,900 | |
| Closed | Hansen Matthew | $225,000 |
Source: Public Records
Tax History
| Year | Tax Paid | Tax Assessment Tax Assessment Total Assessment is a certain percentage of the fair market value that is determined by local assessors to be the total taxable value of land and additions on the property. | Land | Improvement |
|---|---|---|---|---|
| 2025 | $1,893 | $265,045 | $0 | $0 |
| 2024 | $2,190 | $285,300 | $0 | $0 |
| 2023 | $2,221 | $270,780 | $0 | $0 |
| 2022 | $2,025 | $235,795 | $0 | $0 |
| 2021 | $1,845 | $333,130 | $60,000 | $273,130 |
| 2020 | $1,595 | $270,100 | $60,000 | $210,100 |
| 2019 | $1,671 | $270,100 | $60,000 | $210,100 |
| 2018 | $1,232 | $193,168 | $60,000 | $133,168 |
| 2017 | $1,159 | $95,645 | $0 | $0 |
| 2016 | $1,177 | $95,645 | $0 | $0 |
| 2015 | $1,181 | $95,645 | $0 | $0 |
| 2014 | $1,153 | $95,645 | $0 | $0 |
| 2013 | -- | $93,535 | $0 | $0 |
Source: Public Records
Map
Nearby Homes
- 2143 N 950 E
- 1593 N 110 W Unit 201
- 611 E 2450 N Unit 1
- 1593 N 110 W Unit 202
- 1593 N 110 W Unit 204
- 1593 N 110 W Unit 203
- 1200 W 1400 N
- 2950 N Mahogony Valley Rd E Unit 7
- 1598 N Sharptail Cir
- 1000 W 2500 N
- 673 E 2000 N
- 2284 N 740 E
- 624 E 2100 N
- 2025 N 1550 E
- 1495 E 2300 N
- 2361 N 740 E
- 2377 N 740 E
- Somerley Plan at Smiling H Ranch
- Viewside Plan at Smiling H Ranch
- Willow Plan at Smiling H Ranch