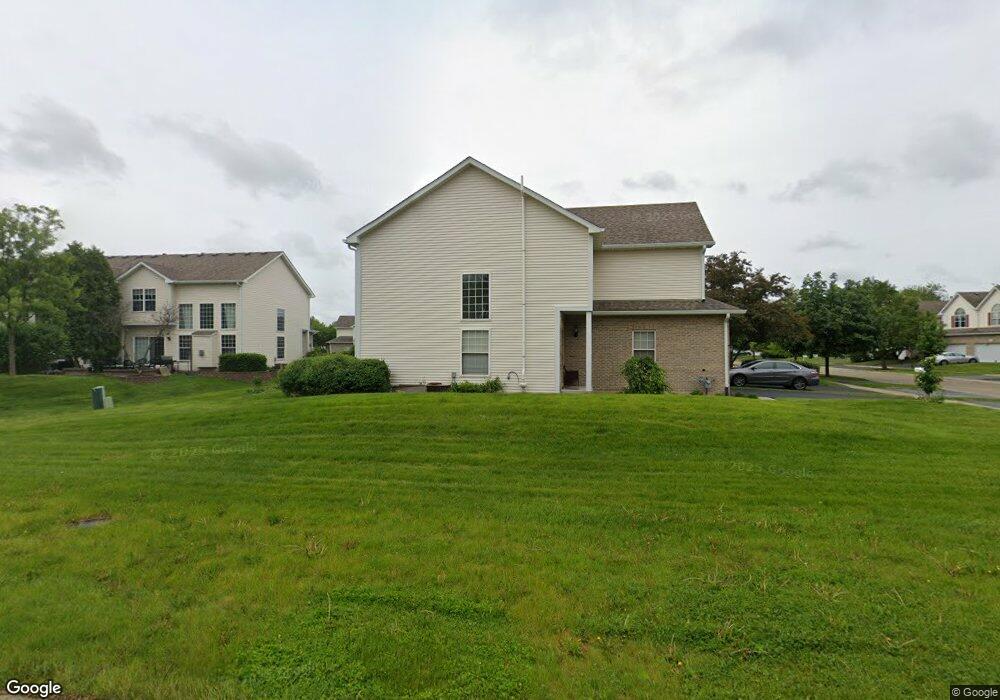
1075 Lily Field Ln Bolingbrook, IL 60440
Balstrode Park NeighborhoodEstimated Value: $357,000 - $370,000
3
Beds
2
Baths
1,724
Sq Ft
$210/Sq Ft
Est. Value
About This Home
This home is located at 1075 Lily Field Ln, Bolingbrook, IL 60440 and is currently estimated at $361,880, approximately $209 per square foot. 1075 Lily Field Ln is a home located in Will County with nearby schools including Jamie Mcgee Elementary School, Jane Addams Middle School, and Brooks Middle School.
Ownership History
Date
Name
Owned For
Owner Type
Purchase Details
Closed on
Nov 29, 2005
Sold by
Gannon Beatrice H and Borges Beatrice H
Bought by
Dhanani Samir
Current Estimated Value
Home Financials for this Owner
Home Financials are based on the most recent Mortgage that was taken out on this home.
Original Mortgage
$200,000
Outstanding Balance
$111,302
Interest Rate
6.2%
Mortgage Type
Fannie Mae Freddie Mac
Estimated Equity
$250,578
Purchase Details
Closed on
Jul 8, 2002
Sold by
Fiala Jason and Fiala Jacqueline
Bought by
Gannon Beatrice H
Home Financials for this Owner
Home Financials are based on the most recent Mortgage that was taken out on this home.
Original Mortgage
$171,000
Interest Rate
5.87%
Mortgage Type
Purchase Money Mortgage
Purchase Details
Closed on
Sep 6, 2000
Sold by
Midwest Bank & Trust Company
Bought by
Fiala Jason D and Fiala Jacqueline
Home Financials for this Owner
Home Financials are based on the most recent Mortgage that was taken out on this home.
Original Mortgage
$160,400
Interest Rate
7.98%
Create a Home Valuation Report for This Property
The Home Valuation Report is an in-depth analysis detailing your home's value as well as a comparison with similar homes in the area
Home Values in the Area
Average Home Value in this Area
Purchase History
| Date | Buyer | Sale Price | Title Company |
|---|---|---|---|
| Dhanani Samir | $250,000 | Ticor Title | |
| Gannon Beatrice H | $221,000 | -- | |
| Fiala Jason D | $169,000 | Greater Illinois Title Compa |
Source: Public Records
Mortgage History
| Date | Status | Borrower | Loan Amount |
|---|---|---|---|
| Open | Dhanani Samir | $200,000 | |
| Previous Owner | Gannon Beatrice H | $171,000 | |
| Previous Owner | Fiala Jason D | $160,400 |
Source: Public Records
Tax History Compared to Growth
Tax History
| Year | Tax Paid | Tax Assessment Tax Assessment Total Assessment is a certain percentage of the fair market value that is determined by local assessors to be the total taxable value of land and additions on the property. | Land | Improvement |
|---|---|---|---|---|
| 2024 | $7,757 | $91,990 | $21,216 | $70,774 |
| 2023 | $7,757 | $82,769 | $19,089 | $63,680 |
| 2022 | $6,783 | $74,621 | $17,210 | $57,411 |
| 2021 | $6,420 | $69,772 | $16,092 | $53,680 |
| 2020 | $6,218 | $67,478 | $15,563 | $51,915 |
| 2019 | $6,011 | $64,265 | $14,822 | $49,443 |
| 2018 | $5,765 | $61,509 | $14,186 | $47,323 |
| 2017 | $5,482 | $58,302 | $13,446 | $44,856 |
| 2016 | $5,316 | $55,500 | $12,800 | $42,700 |
| 2015 | $4,961 | $53,300 | $12,300 | $41,000 |
| 2014 | $4,961 | $50,700 | $11,700 | $39,000 |
| 2013 | $4,961 | $54,500 | $12,600 | $41,900 |
Source: Public Records
Map
Nearby Homes
- 1103 Lily Field Ln
- 1086 Lily Field Ln
- 20 Lily Ct
- 1170 Coventry Ln
- 238 Paddington Ln
- 140 Thackeray Dr
- V Lily Cache Ln
- 109 Commonwealth Dr
- 4 Claridge Ct
- 304 Claridge Cir
- 141 Campbell Dr
- 156 Glen Lake Dr
- 1133 Bramble Ave
- 1132 Partridge Ave
- 309 Inner Circle Dr
- 1152 Partridge Ave
- 333 Inner Circle Dr
- 836 Lily Cache Ln
- 1031 Bothwell Cir
- 105 S Canyon Dr
- 1071 Lily Field Ln
- 1079 Lily Field Ln
- 1 Lily Ct
- 2 Lily Ct
- 3 Lily Ct
- 4 Lily Ct
- 1095 Lily Field Ln
- 1095 Lily Field Ln Unit 4
- 1074 Lily Field Ln
- 1070 Lily Field Ln
- 1078 Lily Field Ln
- 1082 Lily Field Ln
- 5 Lily Ct
- 5 Lily Ct
- 1099 Lily Field Ln
- 1114 Coventry Ln
- 1090 Lily Field Ln
- 6 Lily Ct
- 6 Lily Ct
- 6 Lily Ct