Estimated Value: $357,000 - $551,000
--
Bed
--
Bath
2,336
Sq Ft
$197/Sq Ft
Est. Value
About This Home
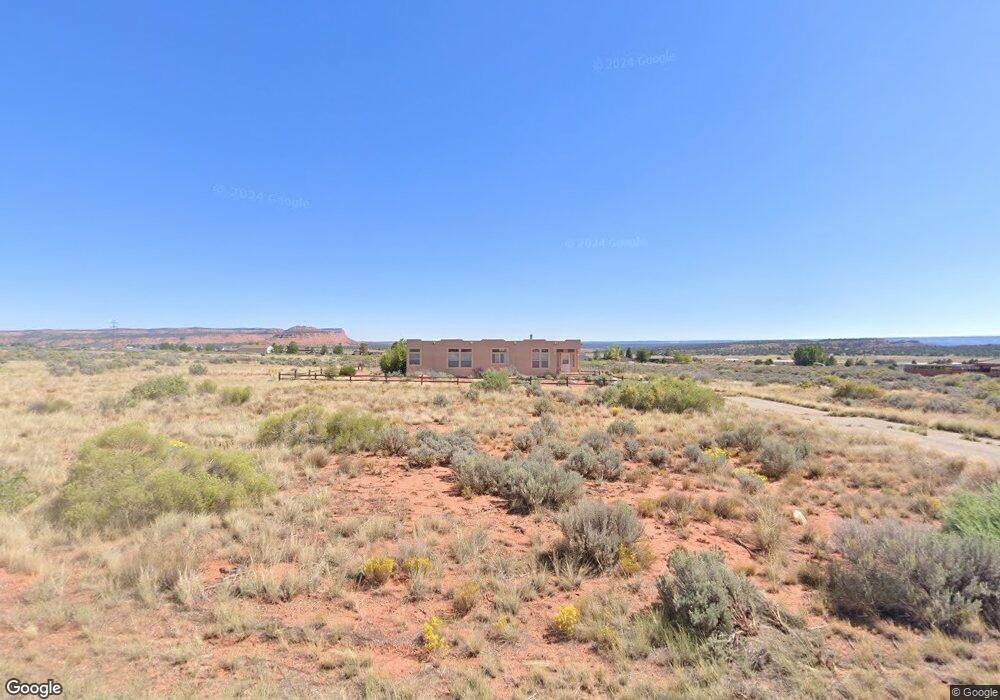
This home is located at 1075 S Kaibab Trail, Kanab, UT 84741 and is currently estimated at $459,787, approximately $196 per square foot. 1075 S Kaibab Trail is a home located in Kane County with nearby schools including Kanab Elementary School, Kanab Middle School, and Kanab High School.
Ownership History
Date
Name
Owned For
Owner Type
Purchase Details
Closed on
Sep 14, 2012
Sold by
Federal Home Loan Mortgage Corporation
Bought by
Phillips Alan Paul and Phillips Evelyn Santos
Current Estimated Value
Purchase Details
Closed on
Feb 27, 2012
Sold by
Etitle Insurance Agency
Bought by
Federal Home Loan Mortgage Corp
Purchase Details
Closed on
Oct 5, 2011
Sold by
Central Mortgage Company
Bought by
Etitle Insurance Agency
Purchase Details
Closed on
Jun 24, 2008
Sold by
Damron Cherie and Camron Cheri
Bought by
Dent John T
Home Financials for this Owner
Home Financials are based on the most recent Mortgage that was taken out on this home.
Original Mortgage
$216,000
Interest Rate
6.04%
Purchase Details
Closed on
May 21, 2008
Sold by
Parker Debbie
Bought by
Dent John T and Camron Cheri
Home Financials for this Owner
Home Financials are based on the most recent Mortgage that was taken out on this home.
Original Mortgage
$216,000
Interest Rate
6.04%
Create a Home Valuation Report for This Property
The Home Valuation Report is an in-depth analysis detailing your home's value as well as a comparison with similar homes in the area
Home Values in the Area
Average Home Value in this Area
Purchase History
| Date | Buyer | Sale Price | Title Company |
|---|---|---|---|
| Phillips Alan Paul | -- | -- | |
| Federal Home Loan Mortgage Corp | -- | -- | |
| Etitle Insurance Agency | -- | -- | |
| Dent John T | -- | -- | |
| Dent John T | -- | -- |
Source: Public Records
Mortgage History
| Date | Status | Borrower | Loan Amount |
|---|---|---|---|
| Previous Owner | Dent John T | $216,000 |
Source: Public Records
Tax History Compared to Growth
Tax History
| Year | Tax Paid | Tax Assessment Tax Assessment Total Assessment is a certain percentage of the fair market value that is determined by local assessors to be the total taxable value of land and additions on the property. | Land | Improvement |
|---|---|---|---|---|
| 2025 | $2,765 | $331,232 | $105,885 | $225,347 |
| 2024 | $2,765 | $219,133 | $86,648 | $132,485 |
| 2023 | $2,265 | $190,633 | $80,229 | $110,404 |
| 2022 | $2,225 | $165,735 | $55,331 | $110,404 |
| 2021 | $2,187 | $244,663 | $77,385 | $167,278 |
| 2020 | $2,083 | $224,899 | $87,120 | $137,779 |
| 2019 | $2,142 | $224,899 | $87,120 | $137,779 |
| 2018 | $2,022 | $210,379 | $72,600 | $137,779 |
| 2017 | $1,963 | $195,507 | $72,600 | $122,907 |
| 2016 | $2,017 | $195,507 | $72,600 | $122,907 |
| 2015 | $1,894 | $200,715 | $69,822 | $130,893 |
| 2014 | $1,894 | $183,149 | $69,822 | $113,327 |
| 2013 | -- | $183,149 | $0 | $0 |
Source: Public Records
Map
Nearby Homes
- 6026 Zion Rd
- 6026 E Zion Rd Unit 7
- 6178 E Zion Rd
- 6178 Zion Rd
- 0 E Zion: Hwy 9 Mile Post 51 Unit 22-233123
- Lot 20 Lone Spur
- Lot 19 Lone Spur
- 1250 Lone Spur Cir
- Lot 11 Lone Spur
- Lot 8 Rowel
- Lot 9 Rowel
- Lot 10 Rowel
- Lot 7 Rowel
- Lot 6 Rowel
- 35 S Sunset Dr
- Lot 5 Boulder Bluff Blvd
- Lot 3 Boulder Bluff Blvd
- Lot 4 Boulder Bluff Blvd
- Lot 2 Boulder Bluff Blvd
- Lot 1 Boulder Bluff Blvd
- Corner S Kaibab Trail
- 16 Kaibab Trail
- * Kaibab Trail
- 19 Kaibab Trail Unit 19
- 1125 S Kaibab Trail
- 951 S Kaibab Trail
- Corner Kaibab Trail
- 1201 S Kaibab Trail
- 5905 Navajo Trail
- 1020 Monument Way
- 1066 Monument Way
- 1088 Monument Way
- 5855 Navajo Trail
- 1142 Monument Way
- 0 Monument Rd
- 970 Monument Way
- 1220 Monument Way
- 1220 Monument Rd
- 1230 S Kaibab Trail
- 1225 S Kaibab Trail