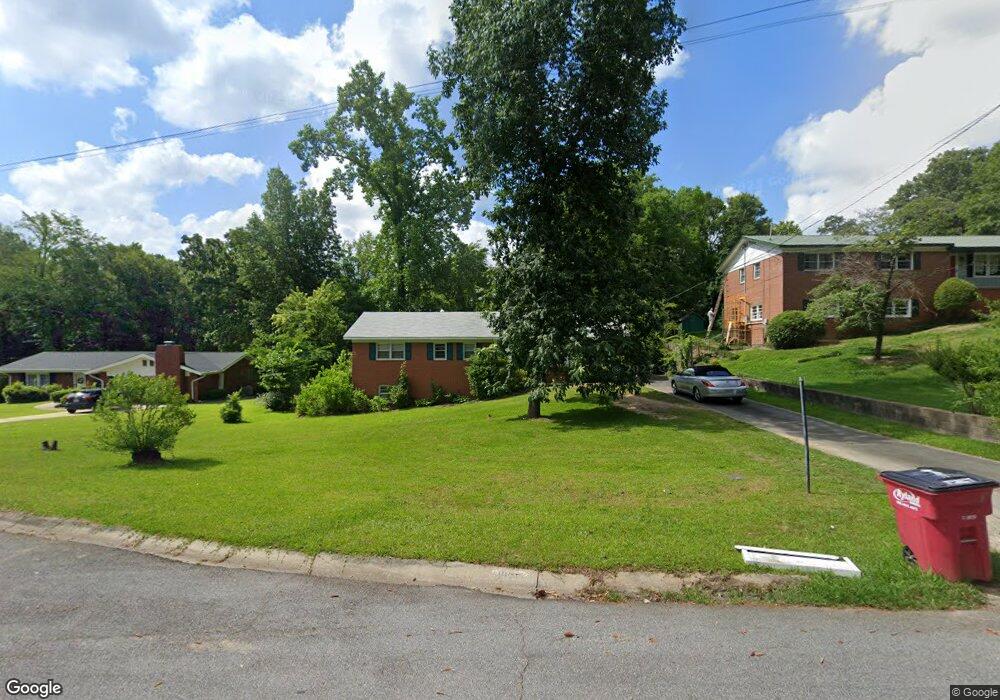
1075 S Pine Knoll Dr Macon, GA 31204
Estimated Value: $146,000 - $187,000
3
Beds
3
Baths
1,352
Sq Ft
$127/Sq Ft
Est. Value
About This Home
This home is located at 1075 S Pine Knoll Dr, Macon, GA 31204 and is currently estimated at $172,207, approximately $127 per square foot. 1075 S Pine Knoll Dr is a home located in Bibb County with nearby schools including Rosa Taylor Elementary School, Howard Middle School, and Howard High School.
Ownership History
Date
Name
Owned For
Owner Type
Purchase Details
Closed on
Mar 26, 2010
Sold by
Peacock Sherry
Bought by
Davis James A
Current Estimated Value
Home Financials for this Owner
Home Financials are based on the most recent Mortgage that was taken out on this home.
Original Mortgage
$98,000
Outstanding Balance
$64,469
Interest Rate
4.91%
Mortgage Type
New Conventional
Estimated Equity
$107,738
Purchase Details
Closed on
Nov 6, 2006
Sold by
Cady William H and Cady Donna V
Bought by
Peacock Sherry
Home Financials for this Owner
Home Financials are based on the most recent Mortgage that was taken out on this home.
Original Mortgage
$95,000
Interest Rate
6.25%
Mortgage Type
New Conventional
Purchase Details
Closed on
May 4, 2006
Sold by
Vickers Welsey
Bought by
Cady William H and Cady Donna V
Home Financials for this Owner
Home Financials are based on the most recent Mortgage that was taken out on this home.
Original Mortgage
$86,610
Interest Rate
6.39%
Mortgage Type
Unknown
Purchase Details
Closed on
Apr 30, 2004
Create a Home Valuation Report for This Property
The Home Valuation Report is an in-depth analysis detailing your home's value as well as a comparison with similar homes in the area
Home Values in the Area
Average Home Value in this Area
Purchase History
| Date | Buyer | Sale Price | Title Company |
|---|---|---|---|
| Davis James A | $98,000 | None Available | |
| Peacock Sherry | $95,000 | None Avilebel | |
| Cady William H | $84,763 | None Available | |
| -- | $91,000 | -- |
Source: Public Records
Mortgage History
| Date | Status | Borrower | Loan Amount |
|---|---|---|---|
| Open | Davis James A | $98,000 | |
| Previous Owner | Peacock Sherry | $95,000 | |
| Previous Owner | Cady William H | $86,610 |
Source: Public Records
Tax History Compared to Growth
Tax History
| Year | Tax Paid | Tax Assessment Tax Assessment Total Assessment is a certain percentage of the fair market value that is determined by local assessors to be the total taxable value of land and additions on the property. | Land | Improvement |
|---|---|---|---|---|
| 2025 | $1,280 | $52,075 | $13,440 | $38,635 |
| 2024 | $1,323 | $52,075 | $13,440 | $38,635 |
| 2023 | $1,195 | $47,036 | $13,440 | $33,596 |
| 2022 | $1,492 | $43,084 | $8,282 | $34,802 |
| 2021 | $1,543 | $40,616 | $8,282 | $32,334 |
| 2020 | $1,365 | $35,160 | $6,776 | $28,384 |
| 2019 | $1,328 | $33,926 | $6,776 | $27,150 |
| 2018 | $1,947 | $29,471 | $6,023 | $23,448 |
| 2017 | $1,058 | $28,237 | $6,023 | $22,214 |
| 2016 | $892 | $25,769 | $6,023 | $19,746 |
| 2015 | $1,420 | $28,990 | $6,776 | $22,214 |
| 2014 | $1,633 | $28,990 | $6,776 | $22,214 |
Source: Public Records
Map
Nearby Homes
- 1068 S Pine Knoll Dr
- 2916 Southshore Dr
- 2958 Glenrock Dr
- 3077 River Ridge Dr
- 233 Riverbend Trail
- 2655 Riverview Rd
- 321 Riverbend Ct
- 796 Lee Rd
- 1017 Clifton Dr
- 1031 Clifton Dr
- 2945 Crestline Dr
- 946 Fair Oaks Dr
- 957 Laurel Oak Ct
- 3150 Misty Valley Ct
- 789 Pinewood Dr
- 1051 Clairmont Place
- 954 Greystone Ct
- 770 Windsor Rd
- 803 Captain Kell Dr
- 740 Valley Trail
- 1071 S Pine Knoll Dr
- 1081 S Pine Knoll Dr
- 1065 S Pine Knoll Dr
- 1083 S Pine Knoll Dr
- 1085 S Pine Knoll Dr
- 1084 S Pine Knoll Dr
- 1072 S Pine Knoll Dr
- 1061 S Pine Knoll Dr
- 1091 S Pine Knoll Dr
- 1094 S Pine Knoll Dr
- 1047 S Pine Knoll Dr
- 1060 S Pine Knoll Dr
- 1058 S Pine Knoll Dr
- 1095 S Pine Knoll Dr
- 1095 N Pine Knoll Dr
- 1098 N Pine Knoll Dr
- 1046 S Pine Knoll Dr
- 1079 N Pine Knoll Dr
- 1075 N Pine Knoll Dr
- 1041 S Pine Knoll Dr