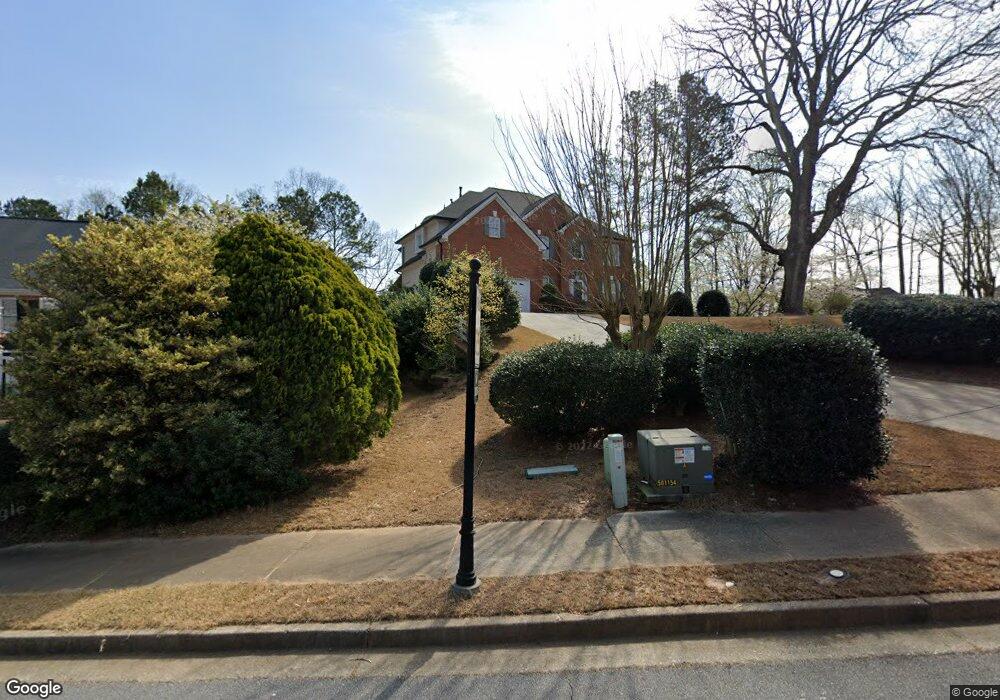
10755 Donamere Dr Alpharetta, GA 30022
Estimated Value: $779,974 - $851,000
4
Beds
3
Baths
3,154
Sq Ft
$256/Sq Ft
Est. Value
About This Home
This home is located at 10755 Donamere Dr, Alpharetta, GA 30022 and is currently estimated at $808,994, approximately $256 per square foot. 10755 Donamere Dr is a home located in Fulton County with nearby schools including State Bridge Crossing Elementary School, Taylor Road Middle School, and Chattahoochee High School.
Ownership History
Date
Name
Owned For
Owner Type
Purchase Details
Closed on
Jun 6, 2003
Sold by
Reck Aric L and Reck Melanie B
Bought by
Kwon In S Kim
Current Estimated Value
Home Financials for this Owner
Home Financials are based on the most recent Mortgage that was taken out on this home.
Original Mortgage
$248,000
Interest Rate
5.16%
Mortgage Type
New Conventional
Purchase Details
Closed on
Dec 20, 1999
Sold by
Green Vance A and Green Wendy G
Bought by
Keck Aric L and Keck Melanie B
Home Financials for this Owner
Home Financials are based on the most recent Mortgage that was taken out on this home.
Original Mortgage
$37,450
Interest Rate
7.68%
Mortgage Type
Credit Line Revolving
Purchase Details
Closed on
Mar 30, 1994
Sold by
Highland Homes Inc
Bought by
Green Vance A Wendy G
Home Financials for this Owner
Home Financials are based on the most recent Mortgage that was taken out on this home.
Original Mortgage
$176,000
Interest Rate
5.25%
Create a Home Valuation Report for This Property
The Home Valuation Report is an in-depth analysis detailing your home's value as well as a comparison with similar homes in the area
Home Values in the Area
Average Home Value in this Area
Purchase History
| Date | Buyer | Sale Price | Title Company |
|---|---|---|---|
| Kwon In S Kim | $310,000 | -- | |
| Keck Aric L | $249,900 | -- | |
| Green Vance A Wendy G | $220,000 | -- |
Source: Public Records
Mortgage History
| Date | Status | Borrower | Loan Amount |
|---|---|---|---|
| Previous Owner | Kwon In S Kim | $248,000 | |
| Previous Owner | Keck Aric L | $37,450 | |
| Previous Owner | Keck Aric L | $187,400 | |
| Previous Owner | Green Vance A Wendy G | $176,000 |
Source: Public Records
Tax History Compared to Growth
Tax History
| Year | Tax Paid | Tax Assessment Tax Assessment Total Assessment is a certain percentage of the fair market value that is determined by local assessors to be the total taxable value of land and additions on the property. | Land | Improvement |
|---|---|---|---|---|
| 2025 | $4,526 | $273,640 | $81,760 | $191,880 |
| 2023 | $7,514 | $266,200 | $60,120 | $206,080 |
| 2022 | $4,331 | $202,360 | $44,840 | $157,520 |
| 2021 | $4,287 | $174,480 | $36,320 | $138,160 |
| 2020 | $4,310 | $160,160 | $42,920 | $117,240 |
| 2019 | $519 | $157,320 | $42,160 | $115,160 |
| 2018 | $4,444 | $153,600 | $41,160 | $112,440 |
| 2017 | $4,255 | $138,080 | $30,800 | $107,280 |
| 2016 | $4,167 | $138,080 | $30,800 | $107,280 |
| 2015 | $4,211 | $138,080 | $30,800 | $107,280 |
| 2014 | $4,098 | $129,240 | $35,800 | $93,440 |
Source: Public Records
Map
Nearby Homes
- 220 Magnolia Tree Ct
- 465 Mikasa Dr
- 5425 Taylor Rd Unit 2
- 230 Pinebridge Ct
- 10840 Mortons Crossing
- 5170 Cameron Forest Pkwy
- 10570 Bridgemor Dr
- 225 Morton Creek Cir
- 165 Morton Walk Dr Unit 1
- 5640 Sandown Way
- 200 Boca Ciega Ct
- 5022 Anclote Dr
- 10296 Quadrant Ct Unit 76
- 10281 Midway Ave
- 4815 Tanners Spring Dr
- 10265 Minion Ct Unit 27
- 4965 Cinnabar Dr
- 11125 Linbrook Ln
- 5060 Cinnabar Dr
- 11035 Parsons Rd
- 10765 Donamere Dr
- 10775 Donamere Dr
- 970 Nightingale Walk
- 100 Donamere Ct
- 280 Laketrail Dr
- 260 Laketrail Dr
- 10750 Donamere Dr
- 975 Nightingale Walk
- 105 Donamere Ct Unit 76
- 105 Donamere Ct
- 270 Laketrail Dr
- 10785 Donamere Dr
- 290 Laketrail Dr
- 960 Nightingale Walk
- 10705 Wren Ridge Rd
- 0 Donamere Ct Unit 8211032
- 0 Donamere Ct Unit 8945796
- 250 Laketrail Dr
- 10715 Wren Ridge Rd
- 110 Donamere Ct