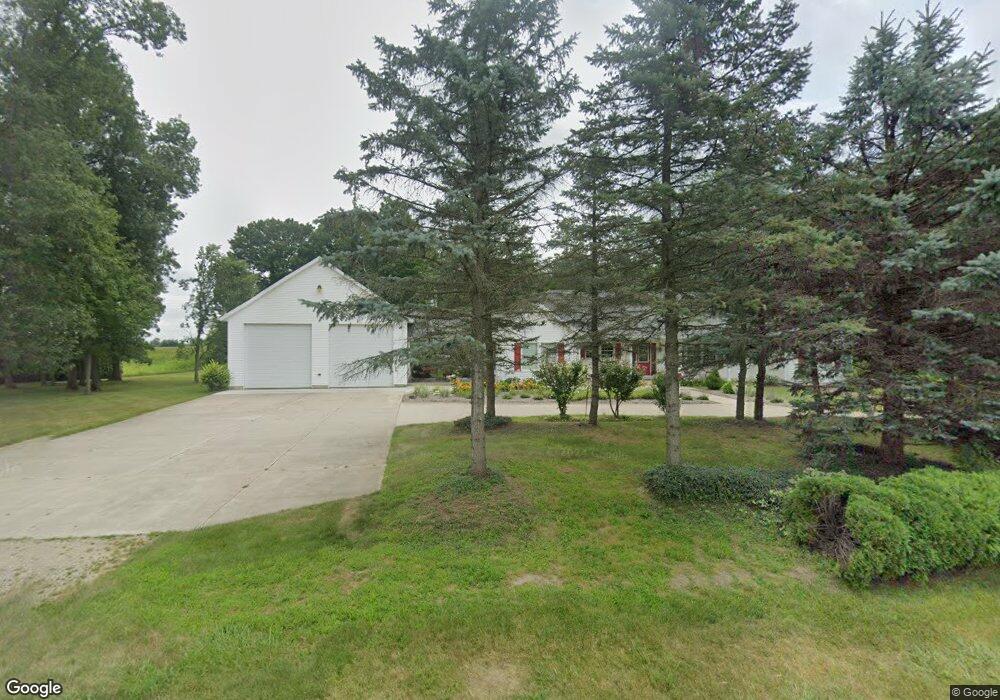
10755 Reading Rd Reading, MI 49274
Estimated Value: $522,000 - $597,000
Studio
3
Baths
2,816
Sq Ft
$194/Sq Ft
Est. Value
About This Home
This home is located at 10755 Reading Rd, Reading, MI 49274 and is currently estimated at $546,019, approximately $193 per square foot. 10755 Reading Rd is a home located in Hillsdale County with nearby schools including Reynolds Elementary School and Reading High School.
Ownership History
Date
Name
Owned For
Owner Type
Purchase Details
Closed on
May 25, 2012
Sold by
Burdick Thomas L and Burdick Caroline R
Bought by
The Denning Living Trust
Current Estimated Value
Purchase Details
Closed on
Feb 11, 2002
Sold by
Adair Scott W and Adair Brenda L
Bought by
Burdick Thomas L and Burdick Caroline R
Purchase Details
Closed on
Oct 27, 2000
Sold by
Wilson-Pleiness Christine J
Bought by
Adair Scott W and Adair Brenda L
Purchase Details
Closed on
Feb 28, 1997
Sold by
Bassage Danny Nelson and Pamela Sue
Bought by
Wilson Christine J
Purchase Details
Closed on
May 3, 1996
Sold by
Pridgeon William G and Pridgeon Martha J
Bought by
Bassage Danny Nelson and Pamela Sue
Purchase Details
Closed on
Jun 27, 1992
Sold by
Pridgeon William G and Pridgeon Martha J
Bought by
Bassage Danny Nelson and Pamela Sue
Purchase Details
Closed on
Oct 16, 1989
Sold by
Beem Derwood V and Beem Mary M
Bought by
Pridgeon William G and Pridgeon Martha J
Create a Home Valuation Report for This Property
The Home Valuation Report is an in-depth analysis detailing your home's value as well as a comparison with similar homes in the area
Purchase History
| Date | Buyer | Sale Price | Title Company |
|---|---|---|---|
| The Denning Living Trust | $300,000 | Midstate Title Agency | |
| Burdick Thomas L | $38,000 | -- | |
| Adair Scott W | $36,900 | -- | |
| Wilson Christine J | $20,000 | -- | |
| Bassage Danny Nelson | $15,000 | -- | |
| Bassage Danny Nelson | $15,000 | -- | |
| Pridgeon William G | $17,000 | -- |
Source: Public Records
Tax History
| Year | Tax Paid | Tax Assessment Tax Assessment Total Assessment is a certain percentage of the fair market value that is determined by local assessors to be the total taxable value of land and additions on the property. | Land | Improvement |
|---|---|---|---|---|
| 2025 | $1,649 | $257,000 | $0 | $0 |
| 2024 | $16 | $228,800 | $0 | $0 |
| 2023 | $1,531 | $219,400 | $0 | $0 |
| 2022 | $3,432 | $184,600 | $0 | $0 |
| 2021 | $3,338 | $164,200 | $0 | $0 |
| 2020 | $3,312 | $165,000 | $0 | $0 |
| 2019 | $3,186 | $142,000 | $0 | $0 |
| 2018 | $3,038 | $121,600 | $0 | $0 |
| 2017 | $2,996 | $126,600 | $0 | $0 |
| 2016 | $3,001 | $133,300 | $0 | $0 |
| 2015 | $1,317 | $133,300 | $0 | $0 |
| 2013 | $1,242 | $113,350 | $0 | $0 |
| 2012 | $1,215 | $110,950 | $0 | $0 |
Source: Public Records
Map
Nearby Homes
- 490 Kelley Rd
- V/L Long Lake Rd
- V L Long Lake Rd
- 9949 Indian Trail
- 5100 Long Lake Rd
- V L Long Lake Rd 2
- 4111 Blair Rd
- 3870 Rus Dic Dr
- 0 W Silver St Unit 25044322
- 219 N Hayward St
- 309 S Main St
- 123 N Main St
- 115 N Michigan St
- 108 Lynn St
- 203 S Main St
- 8875 Kellogg Dr
- 316 S Main St
- 9059 Kellogg Dr
- 9055 Kellogg Dr
- 8941 Kellogg Dr
- 10755 Reading Rd
- 10700 Reading Rd
- 10540 Reading Rd
- 10540 Reading Rd
- 6660 Hakes Rd
- 530 Kelley Rd
- 10339 Reading Rd
- 10400 Reading Rd
- 6831 Hakes Rd
- 6900 Hakes Rd
- 10311 Reading Rd
- 598 Kelley Rd
- 520 Kelley Rd
- 520 Kelley Rd
- 10251 Reading Rd
- 10815 Rood Rd
- 10711 Rood Rd
- 0 Culver Rd
- V/L Culver Rd
- 7131 Hakes Rd
Your Personal Tour Guide
Ask me questions while you tour the home.