Estimated Value: $432,000 - $568,000
3
Beds
1
Bath
1,073
Sq Ft
$447/Sq Ft
Est. Value
About This Home
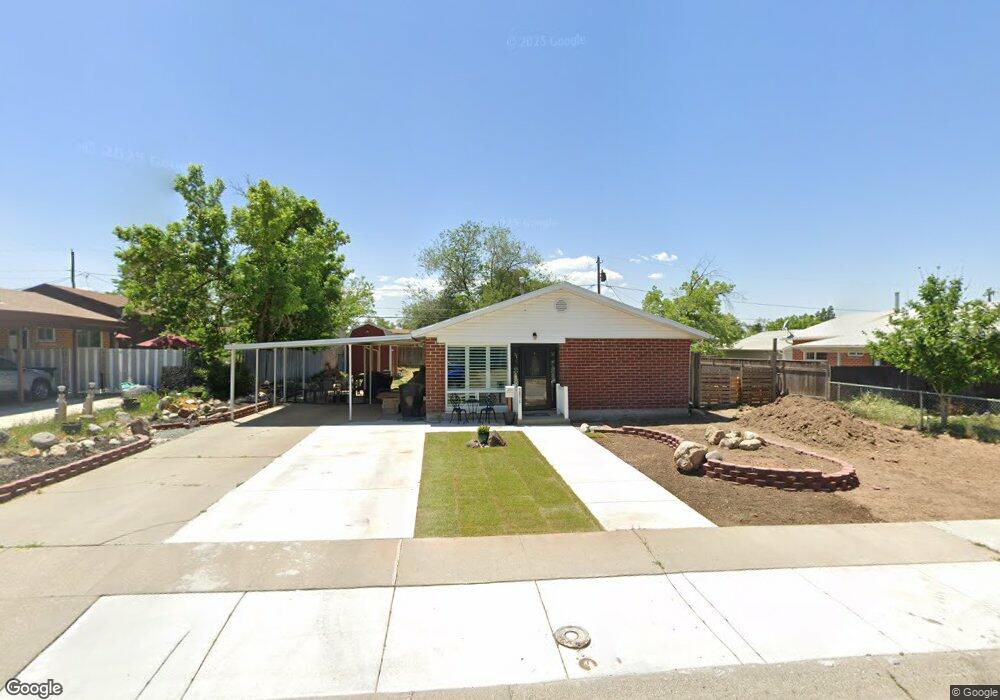
This home is located at 1076 Diamond Way, Sandy, UT 84094 and is currently estimated at $479,676, approximately $447 per square foot. 1076 Diamond Way is a home located in Salt Lake County with nearby schools including Glacier Hills Elementary, Eastmont Middle School, and Jordan High.
Ownership History
Date
Name
Owned For
Owner Type
Purchase Details
Closed on
Aug 25, 2025
Sold by
Offret Shawn
Bought by
Cross Chandler
Current Estimated Value
Home Financials for this Owner
Home Financials are based on the most recent Mortgage that was taken out on this home.
Original Mortgage
$427,500
Outstanding Balance
$427,500
Interest Rate
6.72%
Mortgage Type
New Conventional
Estimated Equity
$52,176
Purchase Details
Closed on
Jul 22, 2025
Sold by
Offret Shawn and Pruitt Sydney
Bought by
Offret Shawn
Home Financials for this Owner
Home Financials are based on the most recent Mortgage that was taken out on this home.
Original Mortgage
$427,500
Outstanding Balance
$427,500
Interest Rate
6.72%
Mortgage Type
New Conventional
Estimated Equity
$52,176
Purchase Details
Closed on
Oct 21, 2022
Sold by
Offret Jean B
Bought by
Offret Shawn and Pruitt Sydney
Purchase Details
Closed on
Oct 4, 2022
Sold by
Diane Offret Revocable Family Trust
Bought by
Offret Shawn and Pruitt Sydney
Purchase Details
Closed on
Aug 17, 2018
Sold by
Offret Diane
Bought by
Offret Diane and The Diane Offret Family Truat
Purchase Details
Closed on
May 15, 2018
Sold by
Offret Leslie W
Bought by
Offret Diane
Create a Home Valuation Report for This Property
The Home Valuation Report is an in-depth analysis detailing your home's value as well as a comparison with similar homes in the area
Home Values in the Area
Average Home Value in this Area
Purchase History
We collect this data history from publicly available records. To have your information removed, we recommend requesting removal directly through your county’s website.
| Date | Buyer | Sale Price | Title Company |
|---|---|---|---|
| Cross Chandler | -- | Ohana Title Insurance Agency | |
| Offret Shawn | -- | Ohana Title Insurance Agency | |
| Offret Shawn | -- | Ohana Title Insurance Agency | |
| Offret Shawn | -- | Novation Title Insurance Agenc | |
| Offret Shawn | -- | Novation Title Insurance Agenc | |
| Offret Diane | -- | None Available | |
| Offret Diane | -- | None Available |
Source: Public Records
Mortgage History
We collect this data history from publicly available records. To have your information removed, we recommend requesting removal directly through your county’s website.
| Date | Status | Borrower | Loan Amount |
|---|---|---|---|
| Open | Cross Chandler | $427,500 |
Source: Public Records
Tax History
| Year | Tax Paid | Tax Assessment Tax Assessment Total Assessment is a certain percentage of the fair market value that is determined by local assessors to be the total taxable value of land and additions on the property. | Land | Improvement |
|---|---|---|---|---|
| 2025 | $2,778 | $429,600 | $124,400 | $305,200 |
| 2024 | $2,778 | $415,700 | $116,200 | $299,500 |
| 2023 | $2,778 | $377,100 | $110,500 | $266,600 |
| 2022 | $2,639 | $382,100 | $108,400 | $273,700 |
| 2021 | $2,046 | $259,300 | $84,200 | $175,100 |
| 2020 | $1,990 | $236,000 | $84,200 | $151,800 |
| 2019 | $1,845 | $216,900 | $79,500 | $137,400 |
| 2018 | $1,647 | $188,300 | $79,500 | $108,800 |
| 2017 | $1,571 | $182,600 | $79,500 | $103,100 |
| 2016 | $1,483 | $168,800 | $79,500 | $89,300 |
| 2015 | $1,415 | $149,700 | $77,100 | $72,600 |
| 2014 | $1,460 | $150,200 | $78,700 | $71,500 |
Source: Public Records
Map
Nearby Homes
- 8813 S Cy's Park Ln Unit 8
- 8817 S Cy's Park Ln Unit 7
- 8812 S Tractor Park Ln E Unit 12
- 38212 W 3800 N
- 8803 S Cy's Park Ln Unit 10
- 1150 E Sego Lily Dr
- 9926 S Lannae Dr
- 954 E Carnation Dr
- 10032 S Blossom Dr
- 1040 E Larkspur Dr
- 915 E Galena Dr
- 941 Statice Ave
- 9771 S Amber Ln
- 9750 S Indian Ridge Dr
- 10272 S Eagle Cliff Way
- 1420 E Firelight Way
- 1528 E Buttercup Dr
- 10106 S Peony Way
- 1119 E 10600 S
- 1456 Firelight Way
- 1092 Platinum Way
- 1088 Platinum Way
- 1088 E Platinum Way
- 1081 Diamond Way
- 1081 E Diamond Way
- 1075 Diamond Way
- 1075 E Diamond Way
- 1087 Diamond Way
- 1098 Platinum Way
- 1093 Platinum Way
- 1082 Platinum Way
- 1089 Platinum Way
- 1067 Diamond Way
- 1067 E Diamond Way
- 1091 Diamond Way
- 1109 Platinum Way
- 1108 Platinum Way
- 1108 E Platinum Way
- 1083 Platinum Way
- 1078 Platinum Way
Your Personal Tour Guide
Ask me questions while you tour the home.